2013 State of the Climate: Earth’s surface temperature
Why it matters
Of all the planets in our neighborhood, Earth has a surface temperature that is uniquely friendly to life. That friendliness is the result of a balancing act between incoming sunlight and outgoing thermal energy—the heat radiated back to space by every part of the Earth system, from land to oceans to clouds and, especially, by the gases in the atmosphere. Surface temperature is one of several signals that indicate the status of Earth’s heat budget. Earth’s long-term warming trend shows that the balance has changed: the atmosphere absorbs and radiates more heat (thermal infrared energy) than it used to.
Conditions in 2013
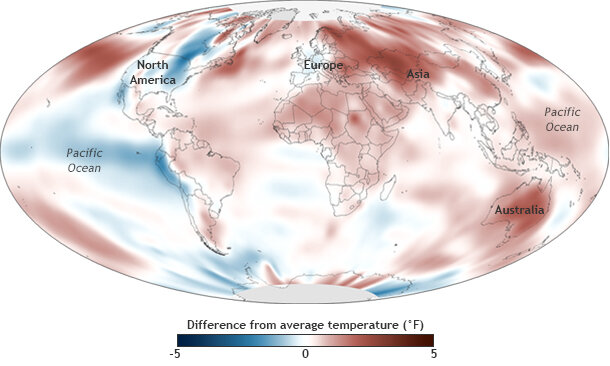
Surface temperatures in 2013 compared to the 1981-2010 average. NOAA map by Dan Pisut, NOAA Environmental Visualization Lab, based on Merged Land and Ocean Surface Temperature data from the National Climatic Data Center. Adapted from Plate 2.1(c) in State of the Climate in 2013.
Surface temperatures in 2013 were warmer than average across most of the world. Notably, Australia had its warmest year since national records began in 1910. Far-western Asia and the far-western Pacific Ocean also saw record-high average temperatures. At the same time, a swath of central North America, the Pacific Ocean west of South America and along the equator, and a few other isolated locations saw cooler-than-average temperatures.
The impacts of temperature on people, agricultural activities, and natural ecosystem are more often related to extreme temperature events than they are to changes in long-term averages, so the 2013 State of the Climate report also included an analysis of worldwide temperature extremes since 1950.
The year 2013 ranked within the top 10 years for the frequency of warm days and in the bottom 10 years for the frequency of cool days. More warm days than average occurred over large parts of Europe, central and east Asia, and Australia, while fewer warm days than average were observed over central North America. Regional and global average time series of these statistics suggest that the increase in warm day frequency and decrease in cool night frequency is part of a long-term trend.
Change over time
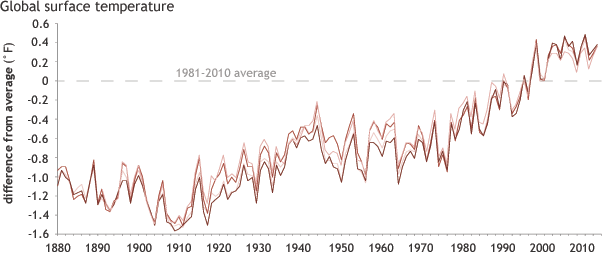
Multiple long-term records of Earth’s average temperature (different colored lines) since the late nineteenth century show a similar pattern: year to year variability combined with a long-term warming trend. The lines shows how far above or below the 1981–2010 average (dashed line at zero) the combined land and ocean temperature has been each year since 1880. Graph adapted from Figure 2.1, in BAMS State of the Climate in 2013.
Globally-averaged surface temperature for 2013 was 0.36 - 0.38° Fahrenheit above the 1981–2010 average, placing it among the top 10 warmest years since record-keeping began. Depending on the dataset considered, the year ranked from second to sixth warmest among the 134 years on record. Relative warming of the equatorial Pacific from cooler-than-average La Niña conditions to ENSO-neutral conditions helped elevate global average temperature slightly above the two previous years.
Since 1976, every year including 2013 has had an average global temperature above the long-term average. Over this 37-year period, temperature warmed at an average of 0.50 °F (0.28 °C) per decade over land and 0.20 °F (0.11 °C) per decade over the ocean.
To calculate global average temperature, four independent teams accessed air temperatures from weather stations on land and sea surface temperatures collected by ships and buoys. Each team used their own methods to analyze and merge the land and ocean datasets to estimate annual temperature for the whole globe. Though their methods differ, all four analyses are in close agreement.
References
A. Sánchez-Lugo, J. J. Kennedy, and P. Berrisford. 2014: [Global climate] Temperature [in “State of the Climate in 2013”]. Bull. Amer. Meteor. Soc., 95 (7), S9-S10.
M.G. Donat and R.J.H. Dunn. 2014: [Global Climate] Temperature Extreme Indices in 2013 [in “State of the Climate in 2013”]. Bull. Amer. Meteor. Soc., 95 (7), S12-S13.
NOAA National Climatic Data Center, State of the Climate - Global Analysis - Annual 2013, published online January 2014, retrieved on June 30, 2014 from https://www.ncdc.noaa.gov/sotc/global/2013/13