It’s been about a month since hundreds of thousands of residents of Toledo, Ohio, on the southwestern shore of Lake Erie, were advised not to drink or shower in their tapwater because of naturally occurring toxins from an overgrowth of algae blooming in the lake. NOAA forecasters say the peak of the summer bloom is likely to occur sometime this month.
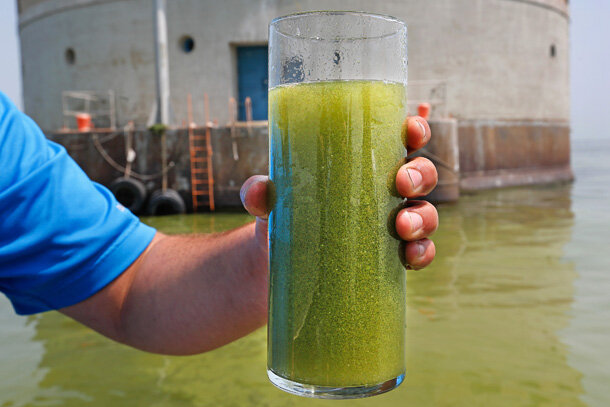
A man holds a glass filled with water from Lake Erie on August 3, 2014. Toledo’s water supply intake sits in the background. Photo copyright Dave Zapotosky.
The primary culprit in these blooms is excess fertilizer—mostly phosphorous—that washes off agricultural land into rivers and streams that flow into the lake. Microscopic algae populations can explode in numbers when nutrient levels in the water climb. Some species of algae produce toxins that can make lake life as well as people sick.
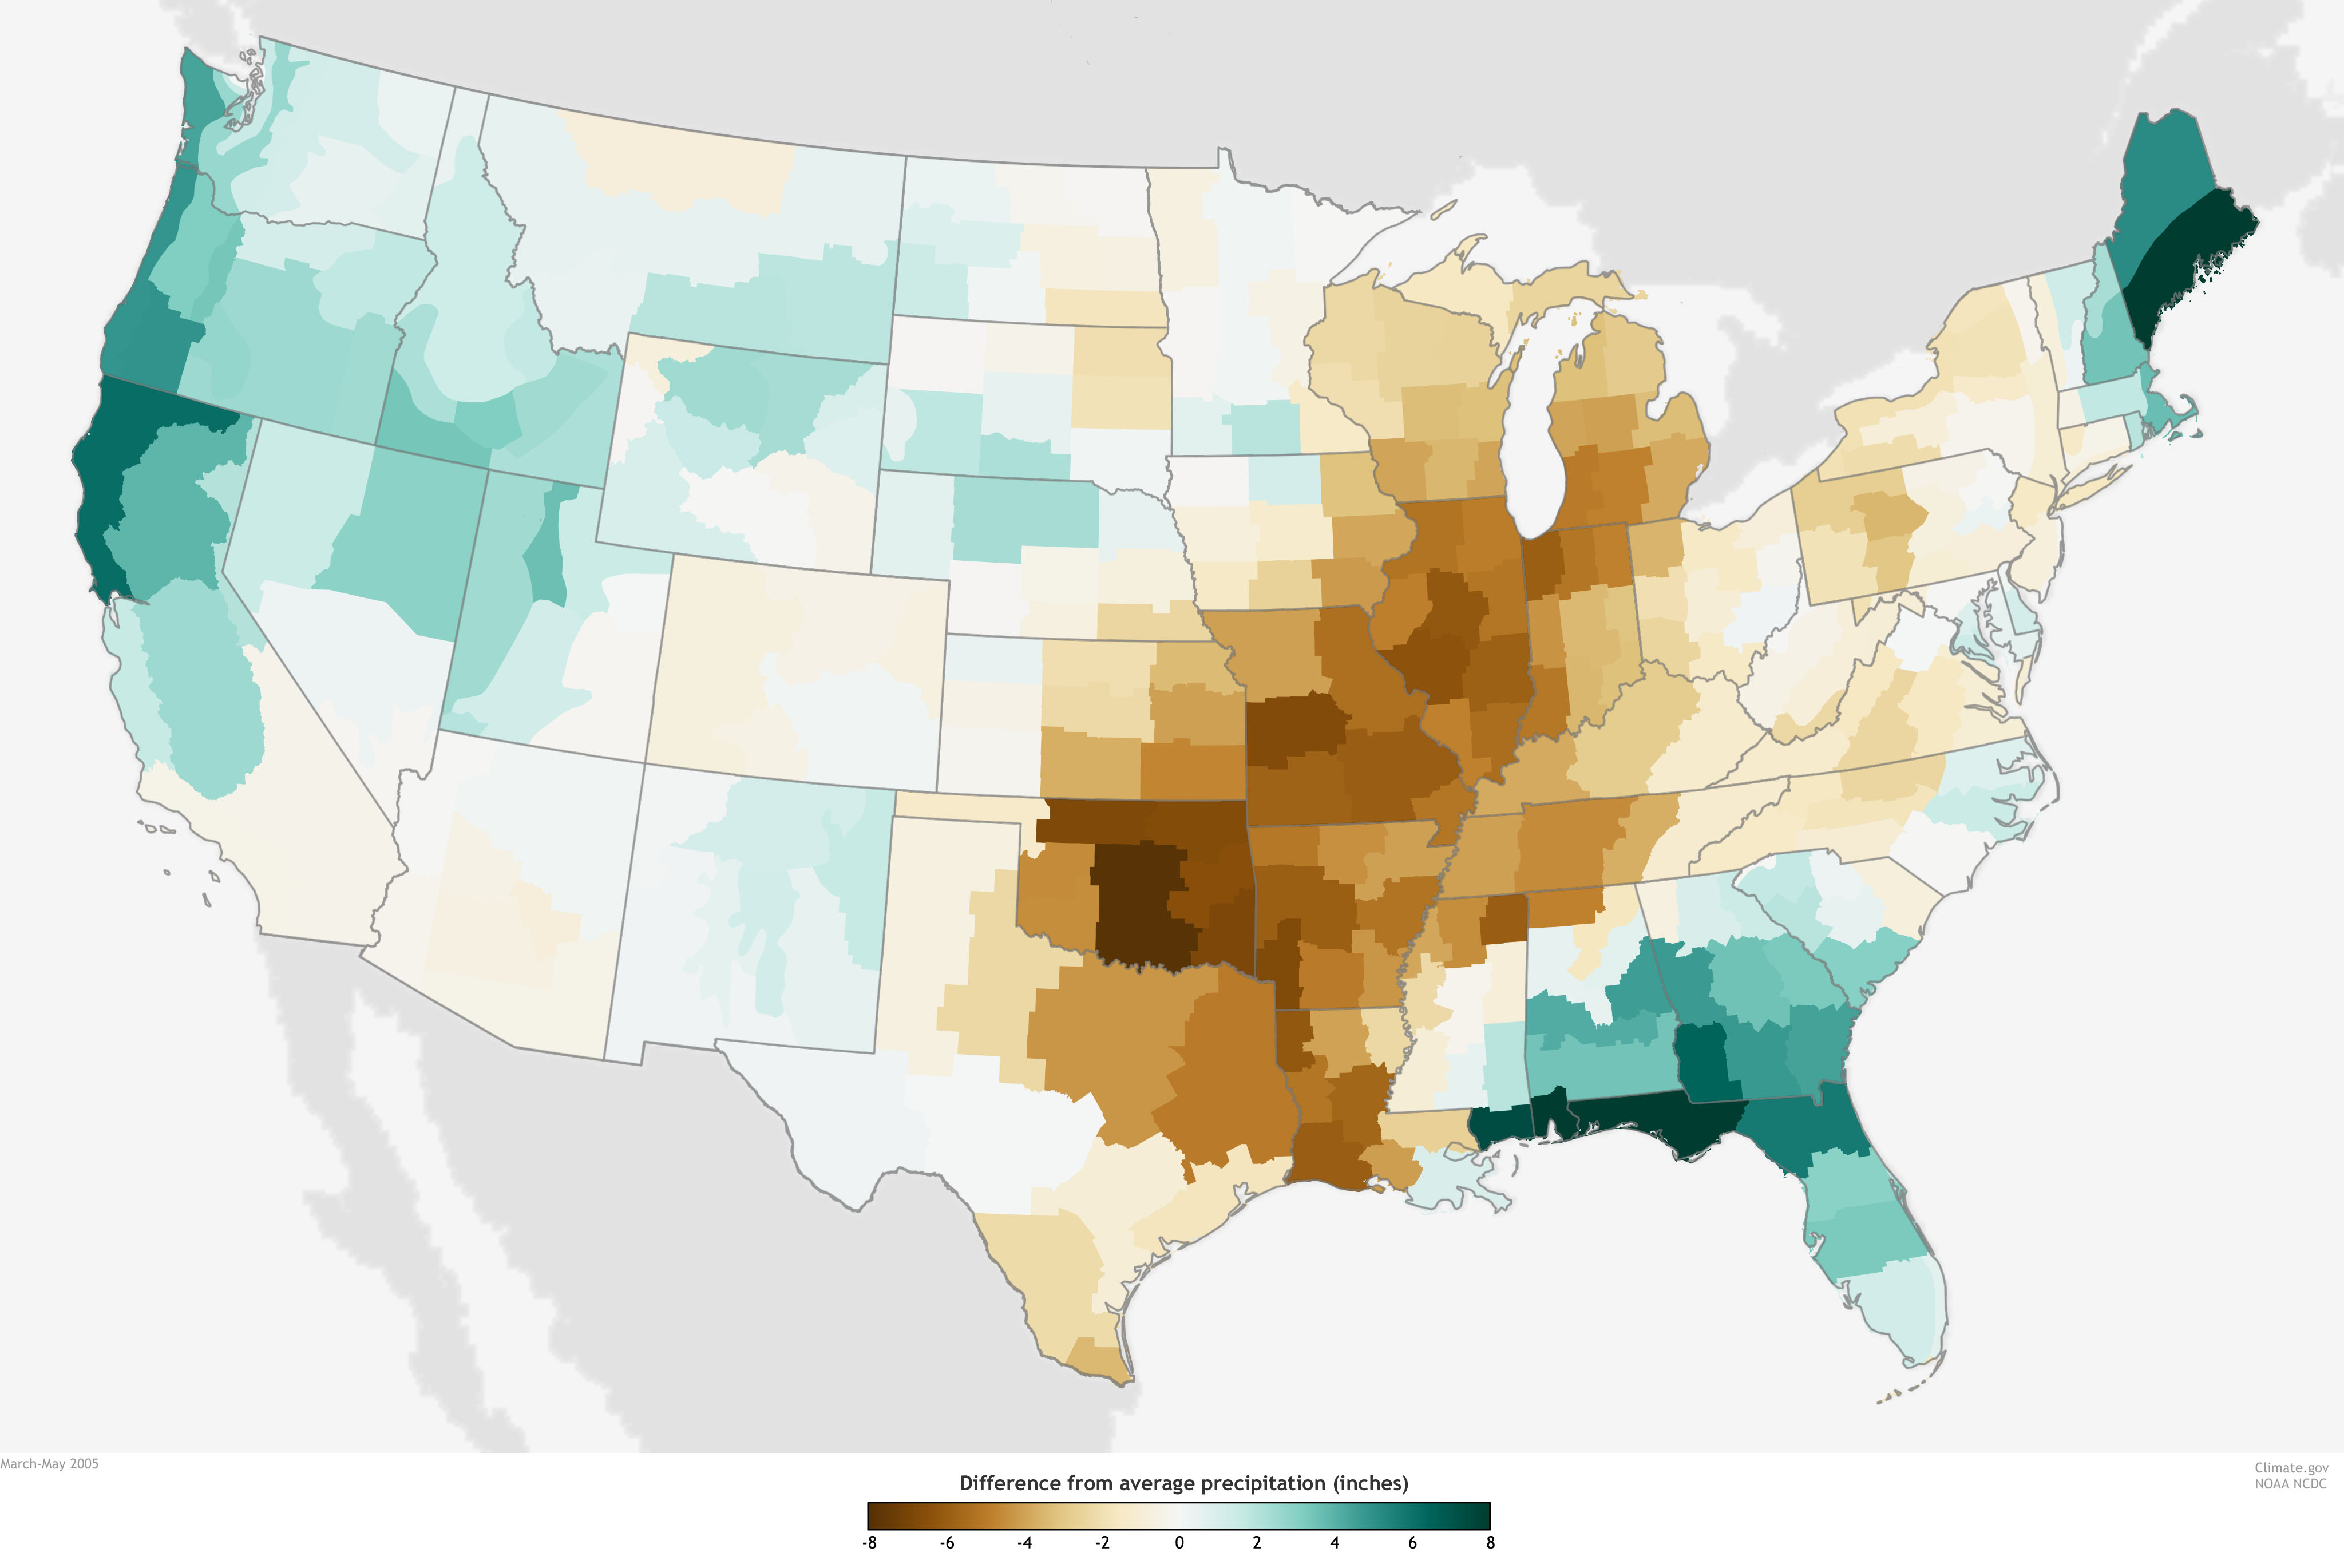
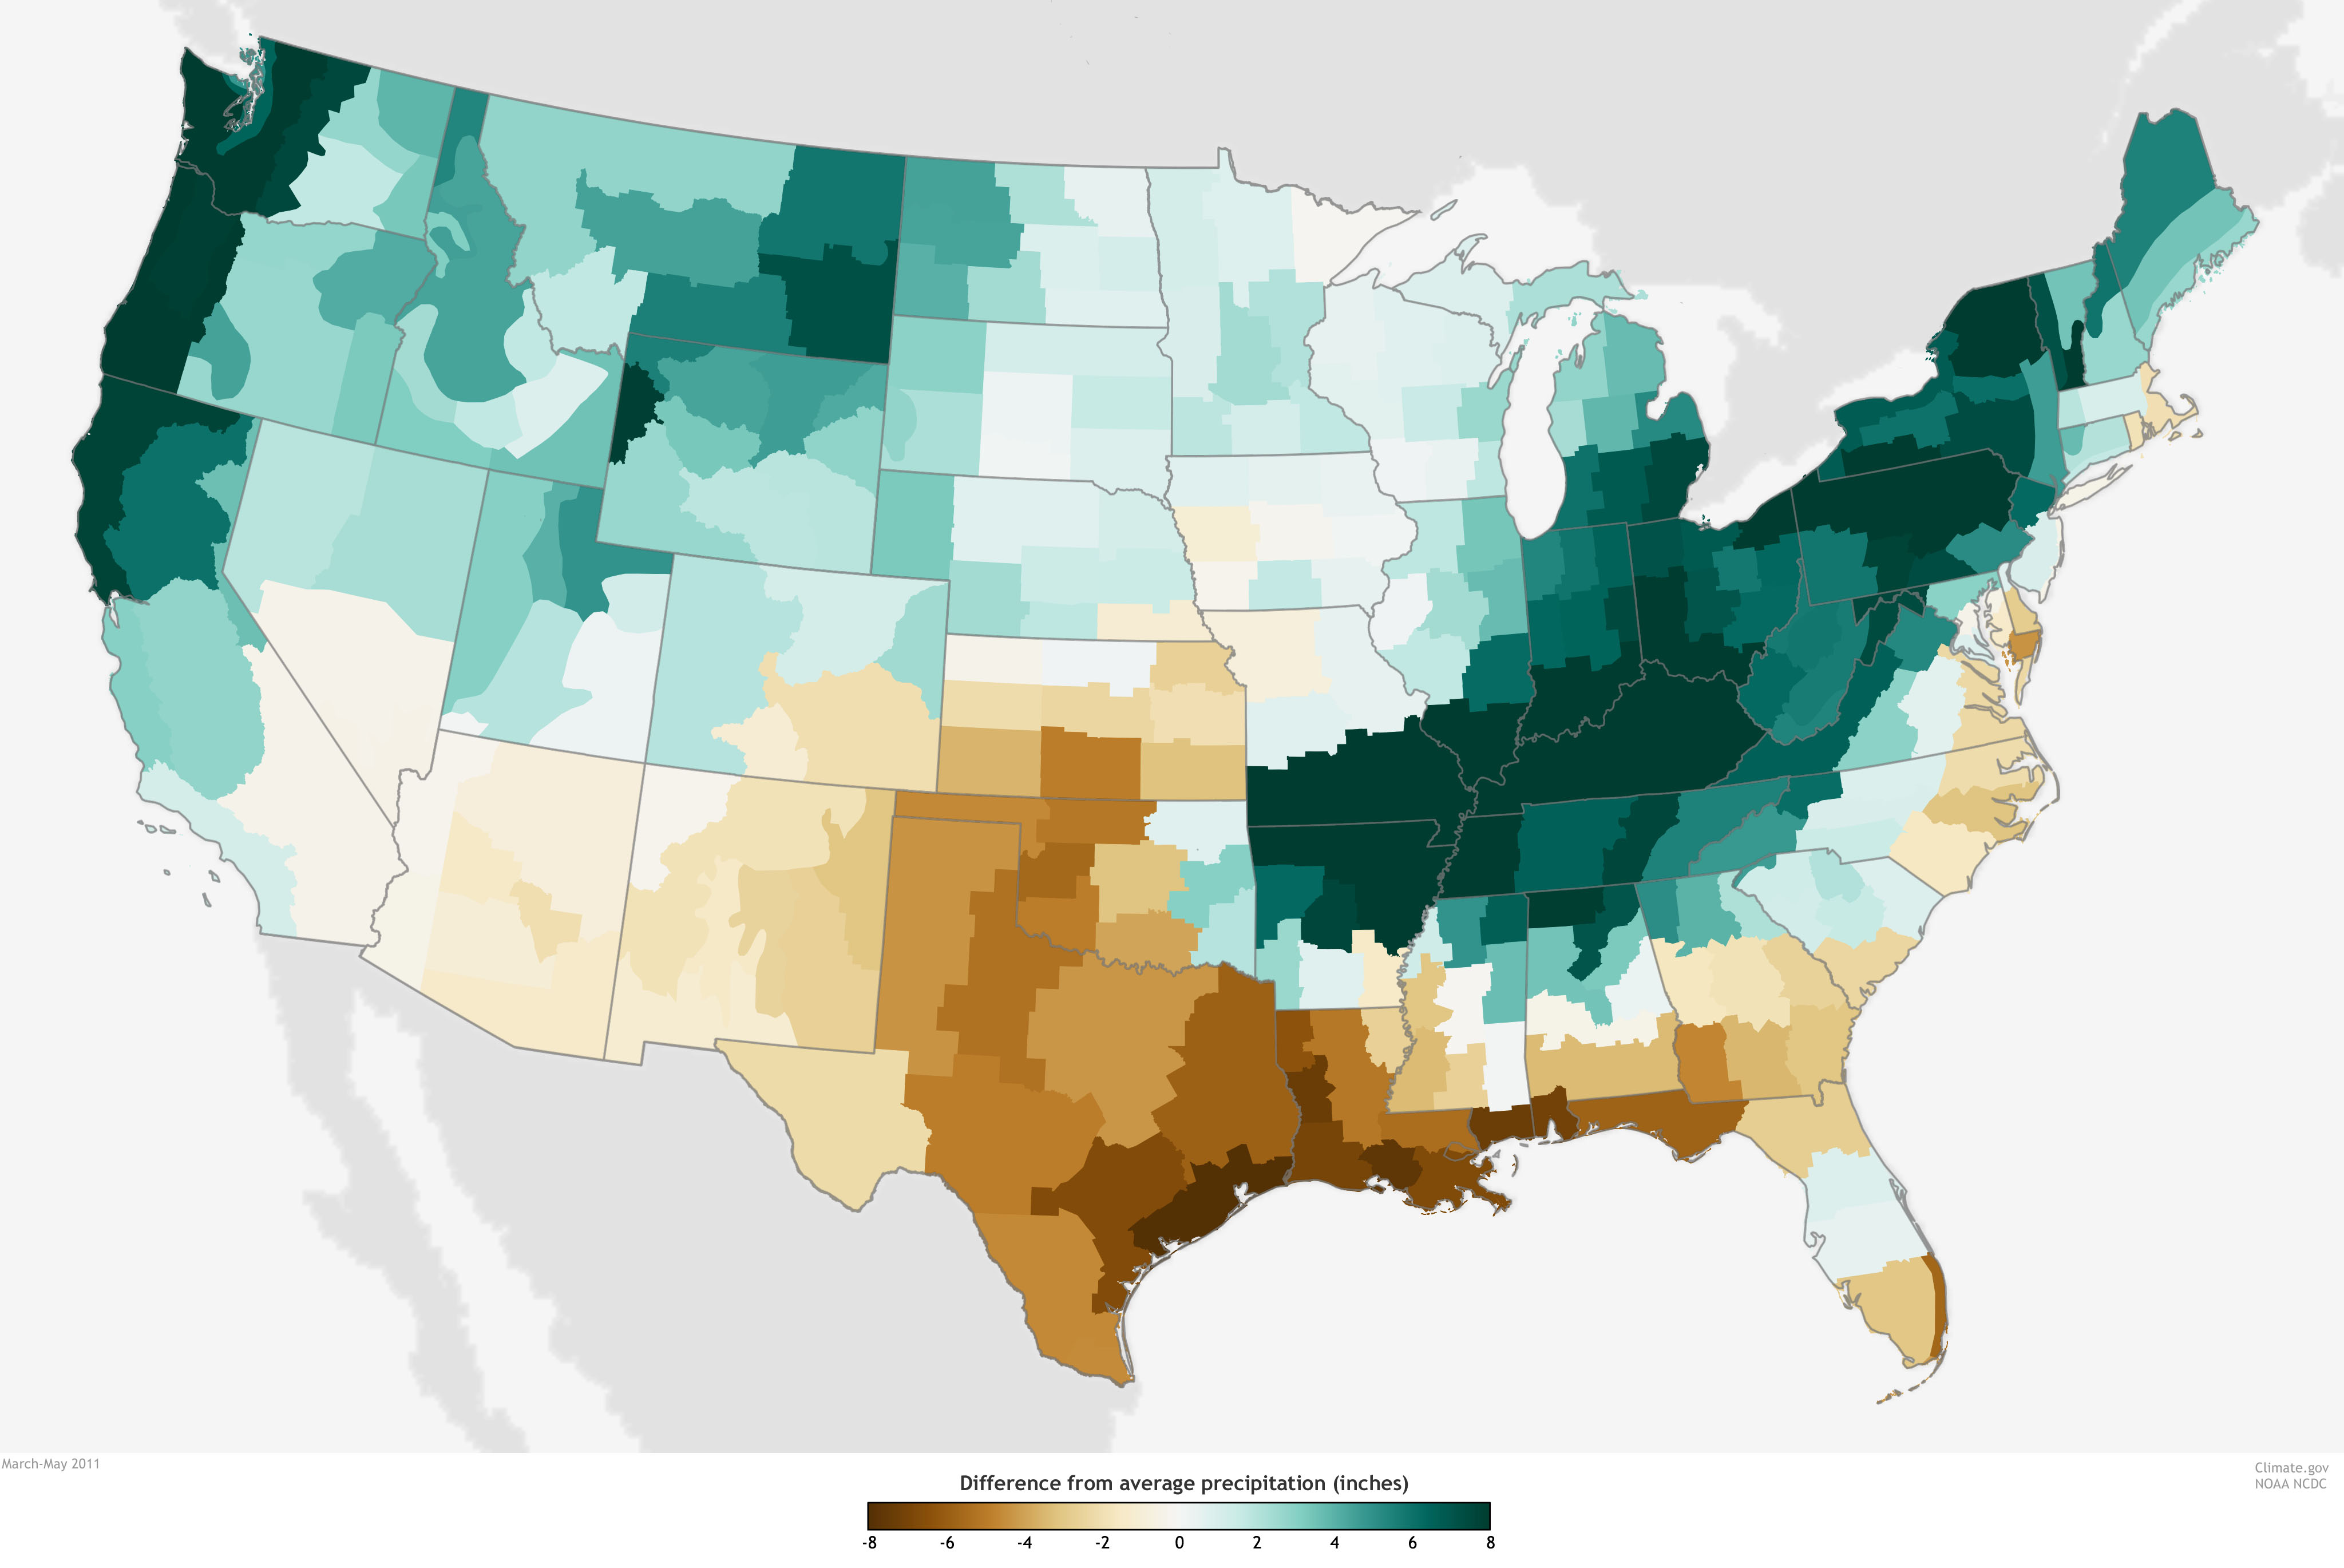
What’s happening on farms and pastures may ultimately be responsible for harmful algal blooms, but seasonal climate largely determines how severe the bloom will be in any given year. As NOAA National Ocean Service scientist Rick Stumpf explains: “Wet springs, with high river discharge, are followed by big summer blooms. Dry springs, with low discharge, aren’t." The typical relationship between seasonal rainfall and Erie’s algae blooms is illustrated by the image below.
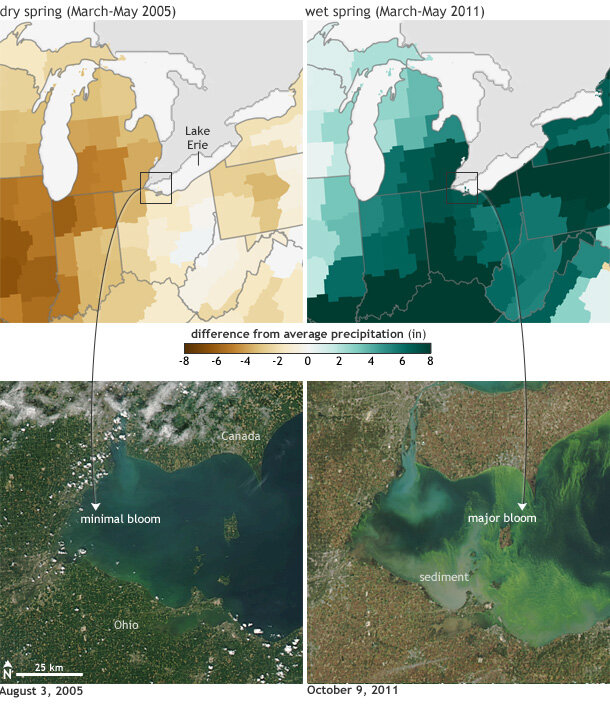
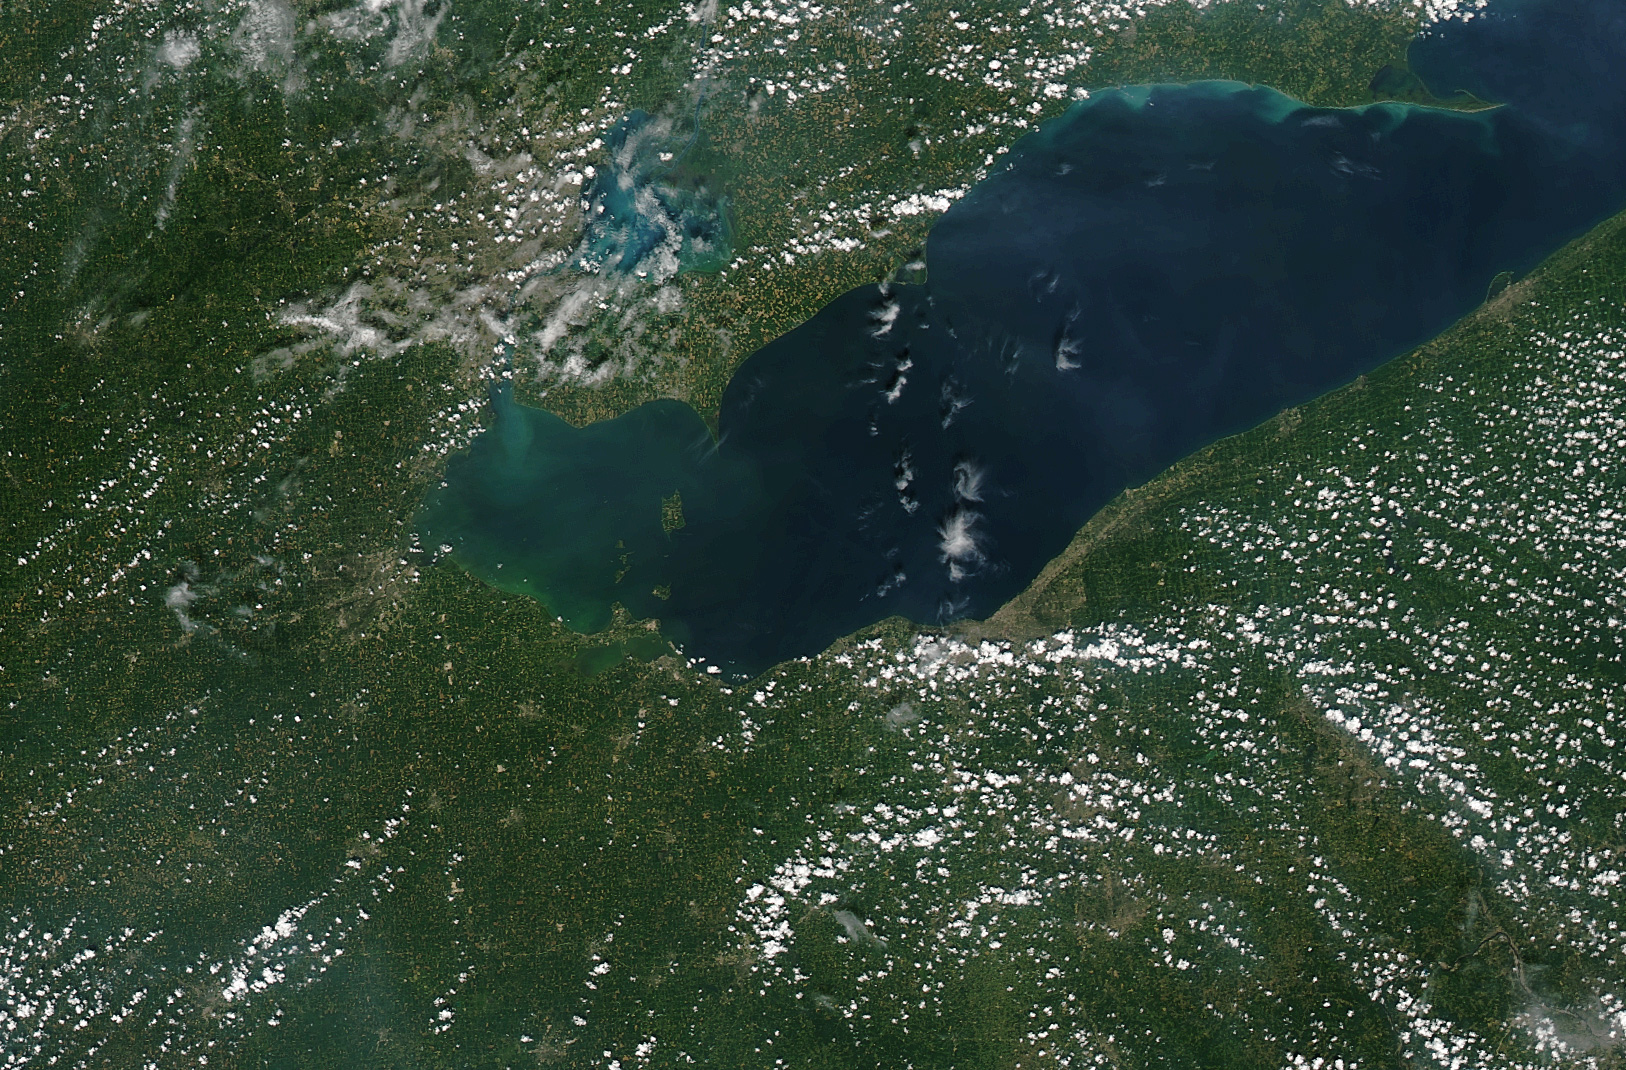
(Top row) Difference from average precipitation for a dry spring (March-May 2005,) and a wet spring (March-May 2011). (Bottom row) NASA satellite image of the western end of Lake Erie in the respective summer/fall. The bloom was minimal in 2005 (left), but dramatic in 2011 (right). large versions: precip 2005 | precip 2011| satellite 2005 | satellite 2011
As far as the 2014 bloom, however, there’s a bit of a mystery. What caused the bloom is straightforward; higher-than-average runoff in the Maumee River watershed, which flows into western Lake Erie, resulted in high concentrations of phosphorous and other fertilizing nutrients. Winds and currents concentrated the algae in exactly the wrong spot: surrounding the Toldeo municipal water intake.
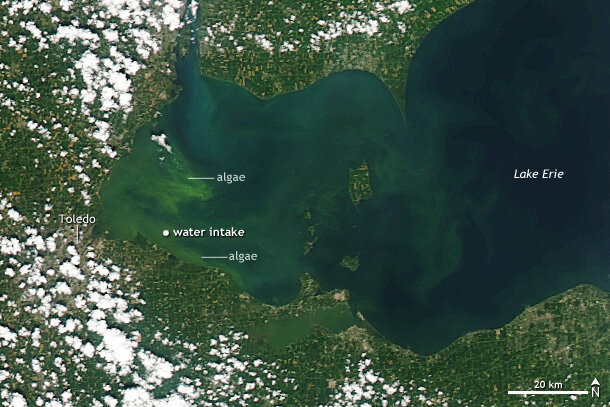
NASA satellite image of toxic algae bloom in Lake Erie on August 3, 2014.
What’s less straightforward about 2014, however, is that runoff was so high, even though precipitation was near or below average across much of the western Lake Erie watershed. “Usually when we compare blooms, we talk about the influence of wet or dry springs,“ explains Stumpf. “Wet springs equal big summer blooms; dry springs equal negligible blooms. The seasonal precipitation is shorthand for what ultimately matters, which is river discharge.“
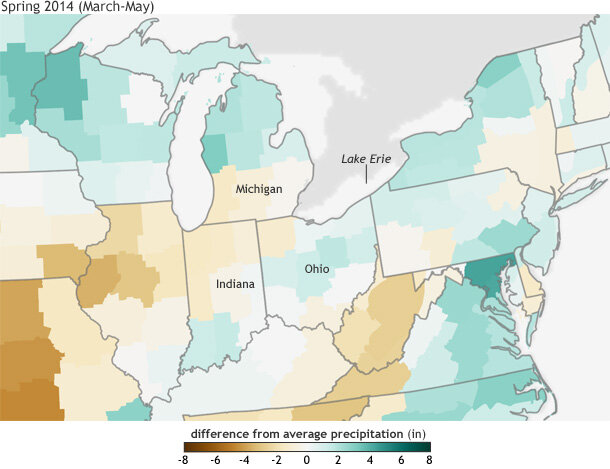
Difference from average (1981-2010) precipitation for March-May 2014, based on U.S. Climate Division Data. Map by NOAA Climate.gov.
It’s usually a good shorthand, Stumpf says, but not this year. “What we see this year is, apparently, high discharge without unusually high precipitation,” says Stumpf. So what’s going on? Stumpf says he doesn’t know. It could be specific to 2014, which had a long cold winter, or an indication of changes in the intensity of rainfall—strong rainfall events lead to more runoff.
He’s started pulling together additional precipitation data, along with temperature and other variables that could be relevant. “If I find a good explanation,” he says, “I’ll let you know.”
Meanwhile, keep an eye on NOAA’s Experimental Harmful Algal Bloom Bulletin, which provides frequent updates of the bloom’s present and forecasted location and intensity.