Extensive sea ice surrounding Antarctica during December 2013 made it even more formidable than usual to access the icy continent. It was in this challenging environment that the Australasian Antarctic Expedition aboard the Russian ship Akademik Shokalskiy became trapped by thick floes of ice in eastern Antarctica’s Commonwealth Bay while following the route navigated by explorer Sir Douglas Mawson a century ago.
The National Snow and Ice Data Center reported that sea ice extent around Antarctica was above average in December. It was the highest December average since 2007 and second highest overall in the satellite record. Throughout 2013, satellites observed record extents for both the annual summer minimum (February) and winter maximum (September).
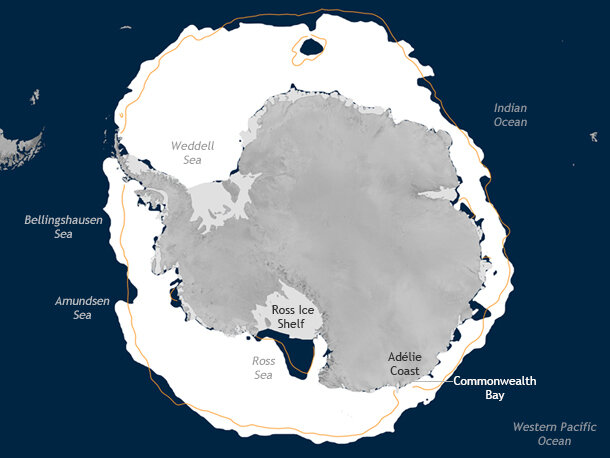
Antarctic sea ice extent in December 2013 (white) compared to the 1981-2010 median (orange line). Land is dark gray, and ice shelves—floating ice platforms connected to land—are light gray. Waters with sea ice concentration less than 15% are dark blue. Commonwealth Bay was unusually ice-choked.
Many factors can lead to increases and decreases in Antarctic sea ice from year to year, including variations in large-scale atmospheric and oceanic circulation patterns and local sea surface temperatures. On a smaller scale, changes in the landscape, or ‘icescape,’ can even transform the way a part of the ocean produces and circulates sea ice. Mawson’s original route, for example, navigated close to a portion of Antarctic coastline that has undergone a huge change in recent years.
In February 2010, the tongue of the Mertz Glacier broke off after being rammed by a huge iceberg known as B09B. Prior to the calving of the glacier, it served as a blocking feature for a polynya—a large body of open water that persists in the middle of sea ice, often near the coast. Although the feature itself is open, a polynya operates like a sea ice factory: its surface freezes, but strong offshore winds repeatedly blow the ice toward the open ocean, which then exposes the surface water again, allowing more ice to form and drift away.
Polynyas are also a major source of the world’s bottom waters, which influence the process of thermohaline circulation. As sea ice forms at the surface, preferentially excluding salt from the crystal structure of ice, the salinity of water below it increases. The increased density of this water causes it to sink, sometimes all the way to the bottom of the ocean. These 'bottom waters' flow out of the Southern Ocean and through other ocean basins, playing a role in the transport of heat from low latitudes to the polar regions. This circulation is sometimes called the global 'conveyer belt'.
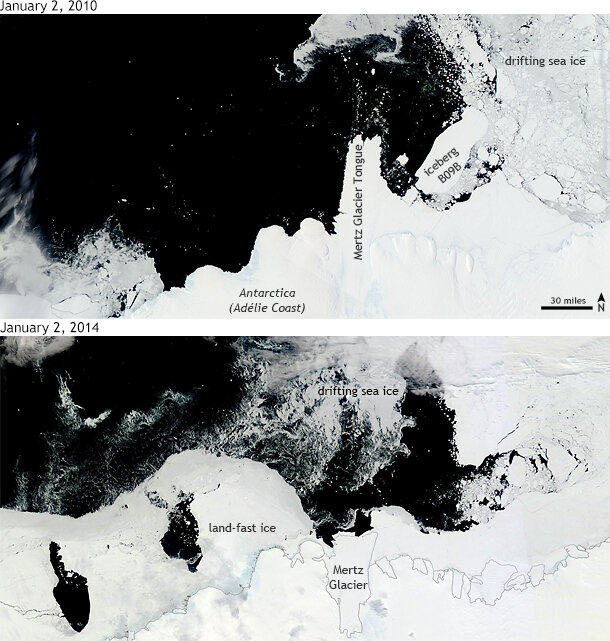
Prior to the loss of the Mertz Glacier Tongue a reliable pocket of open water existed off the Adélie Coast (top). Since the tongue was lost, the region has become more ice-choked and less accessible (bottom). NASA images courtesy the MODIS Rapid Response Project.
Four years after the collision, the loss of the Mertz Glacier Tongue has transformed the shoreline, removing the features of the icescape that once blocked sea ice from entering the open water areas west of the glacier. In addition, as the B-09B iceberg slowly migrated west and lodged itself near Commonwealth Bay, its new position blocked the transport of sea ice away from the Mertz Glacier Polynya. The extensive sea ice lingering in the region has made it challenging for research ships to access the area.
Another factor hindering the Akademik Shokalskiy’s access to the Adélie Coast in December 2013 was simply bad weather. The Commonwealth Bay region—recognized as one of the windiest places on Earth—is often swept clear of ice by this time during the Antarctic summer season (October-February) by strong katabatic offshore winds, which drive sea ice away from the coastline. But according to a recent December sea ice analysis from the National Snow and Ice Data Center, this particular region experienced “long periods of northeasterly airflow, pushing the sea ice against the coast, and piling up the thinner flows into a nearly impenetrable mass.”
It might seem counter-intuitive, but more ice in the immediate vicinity of the Mertz Glacier may translate into less ice in the region overall. The reconfiguration of the icescape has caused a disruption of the polynya’s sea ice factory; as the lingering sea ice covers up more of the water’s surface, it slows down new ice formation. In a 2012 study, a group of scientists used satellite data to estimate that total sea ice production for the region in 2010 and 2011 was 144 and 134 cubic kilometers, respectively, representing a 14–20% decrease from the 2000–2009 average. Researchers are investigating whether the abrupt structural changes to the icescape could result in permanently decreased polynya activity, sea ice production, and Antarctic bottom water export over future decades.
When you zoom out to look at sea ice trends around the entire continent, the story is complex as well. Overall, Antarctic sea ice has grown very slightly over the past thirty years of the satellite record, but trends remain small (1 to 4% per decade) and vary among the continent’s five ocean regions. Since the late 1970s, the main areas of overall sea ice extent growth were in the Ross Sea, followed by the Weddell Sea and Indian Ocean. Meanwhile, ice extent in the Bellingshausen and Amundsen seas declined dramatically. The Western Pacific Ocean—the region of the ocean that the Akademik Shokalskiy navigated through—recorded a mixture of positive and negative monthly ice extent trends throughout a 30-year period.
What has allowed Antarctic sea ice to grow as the Southern Ocean has warmed? A new study showed that the westerly winds swirling around the South Pole have become stronger in the last few decades. Strong winds cause ice to pile up in ridges, while at the same time creating openings in the sea ice cover in which new ice can form. The cause behind the stronger polar winds is still unknown, but scientists are looking into several potential culprits including global warming, changes in ocean circulation, ozone depletion in the Southern Hemisphere, or just natural variability.
Related Links
NASA Earth Observatory (2010, February 27) Collision calves iceberg from Mertz Glacier Tongue, Antarctica
National Snow and Ice Data Center (2012, January 11) Sea Ice down under: Antarctic ice and climate
National Snow and Ice Data Center (2014, January 8) A slow and bumpy climb
References
Parkinson, C. L. and Cavalieri, D. J., 2012: Antarctic sea ice variability and trends, 1979–2010. The Cryosphere, 6, 871-880.
Tamura, T. et al., 2012: Potential regime shift in decreased sea ice production after the Mertz Glacier calving. Nat. Commun. 3:826
Zhang, Jinlun, 2014: Modeling the Impact of Wind Intensification on Antarctic Sea Ice Volume. J. Climate, 27, 202–214.