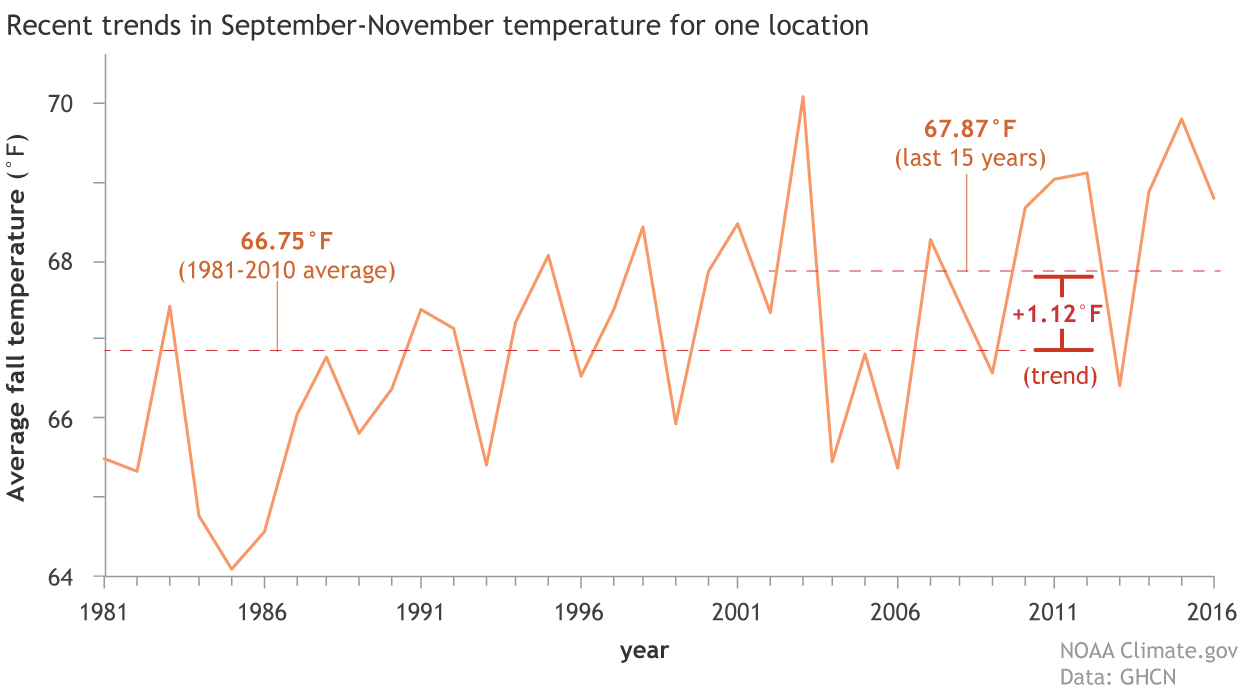
File name: CPC_forecast_trends_example_lrg.gif
Original Resolution: 1240 × 690
File Size: 35 KB (MIME Type: image/gif)
Climate.gov Media