
Image caption
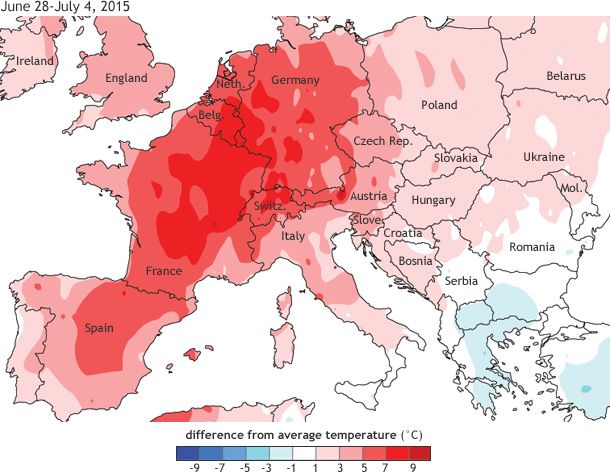
Average temperature anomalies (°C) for Europe during June 28-July 4, 2015 based on preliminary global weather station data. A heat wave across the continent led to average temperature anomalies up to 7°C in parts of western Europe. Image provided by NOAA's Climate Prediction Center.