File name: Chile-OISSTA_201503_weeklyAvgs-610.jpg
Original Resolution: 610 × 370
File Size: 180 KB (MIME Type: image/jpeg)
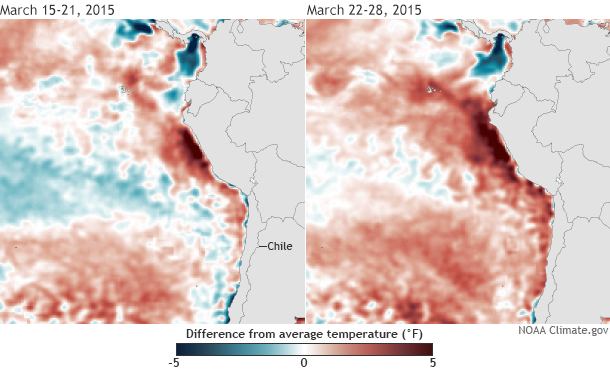
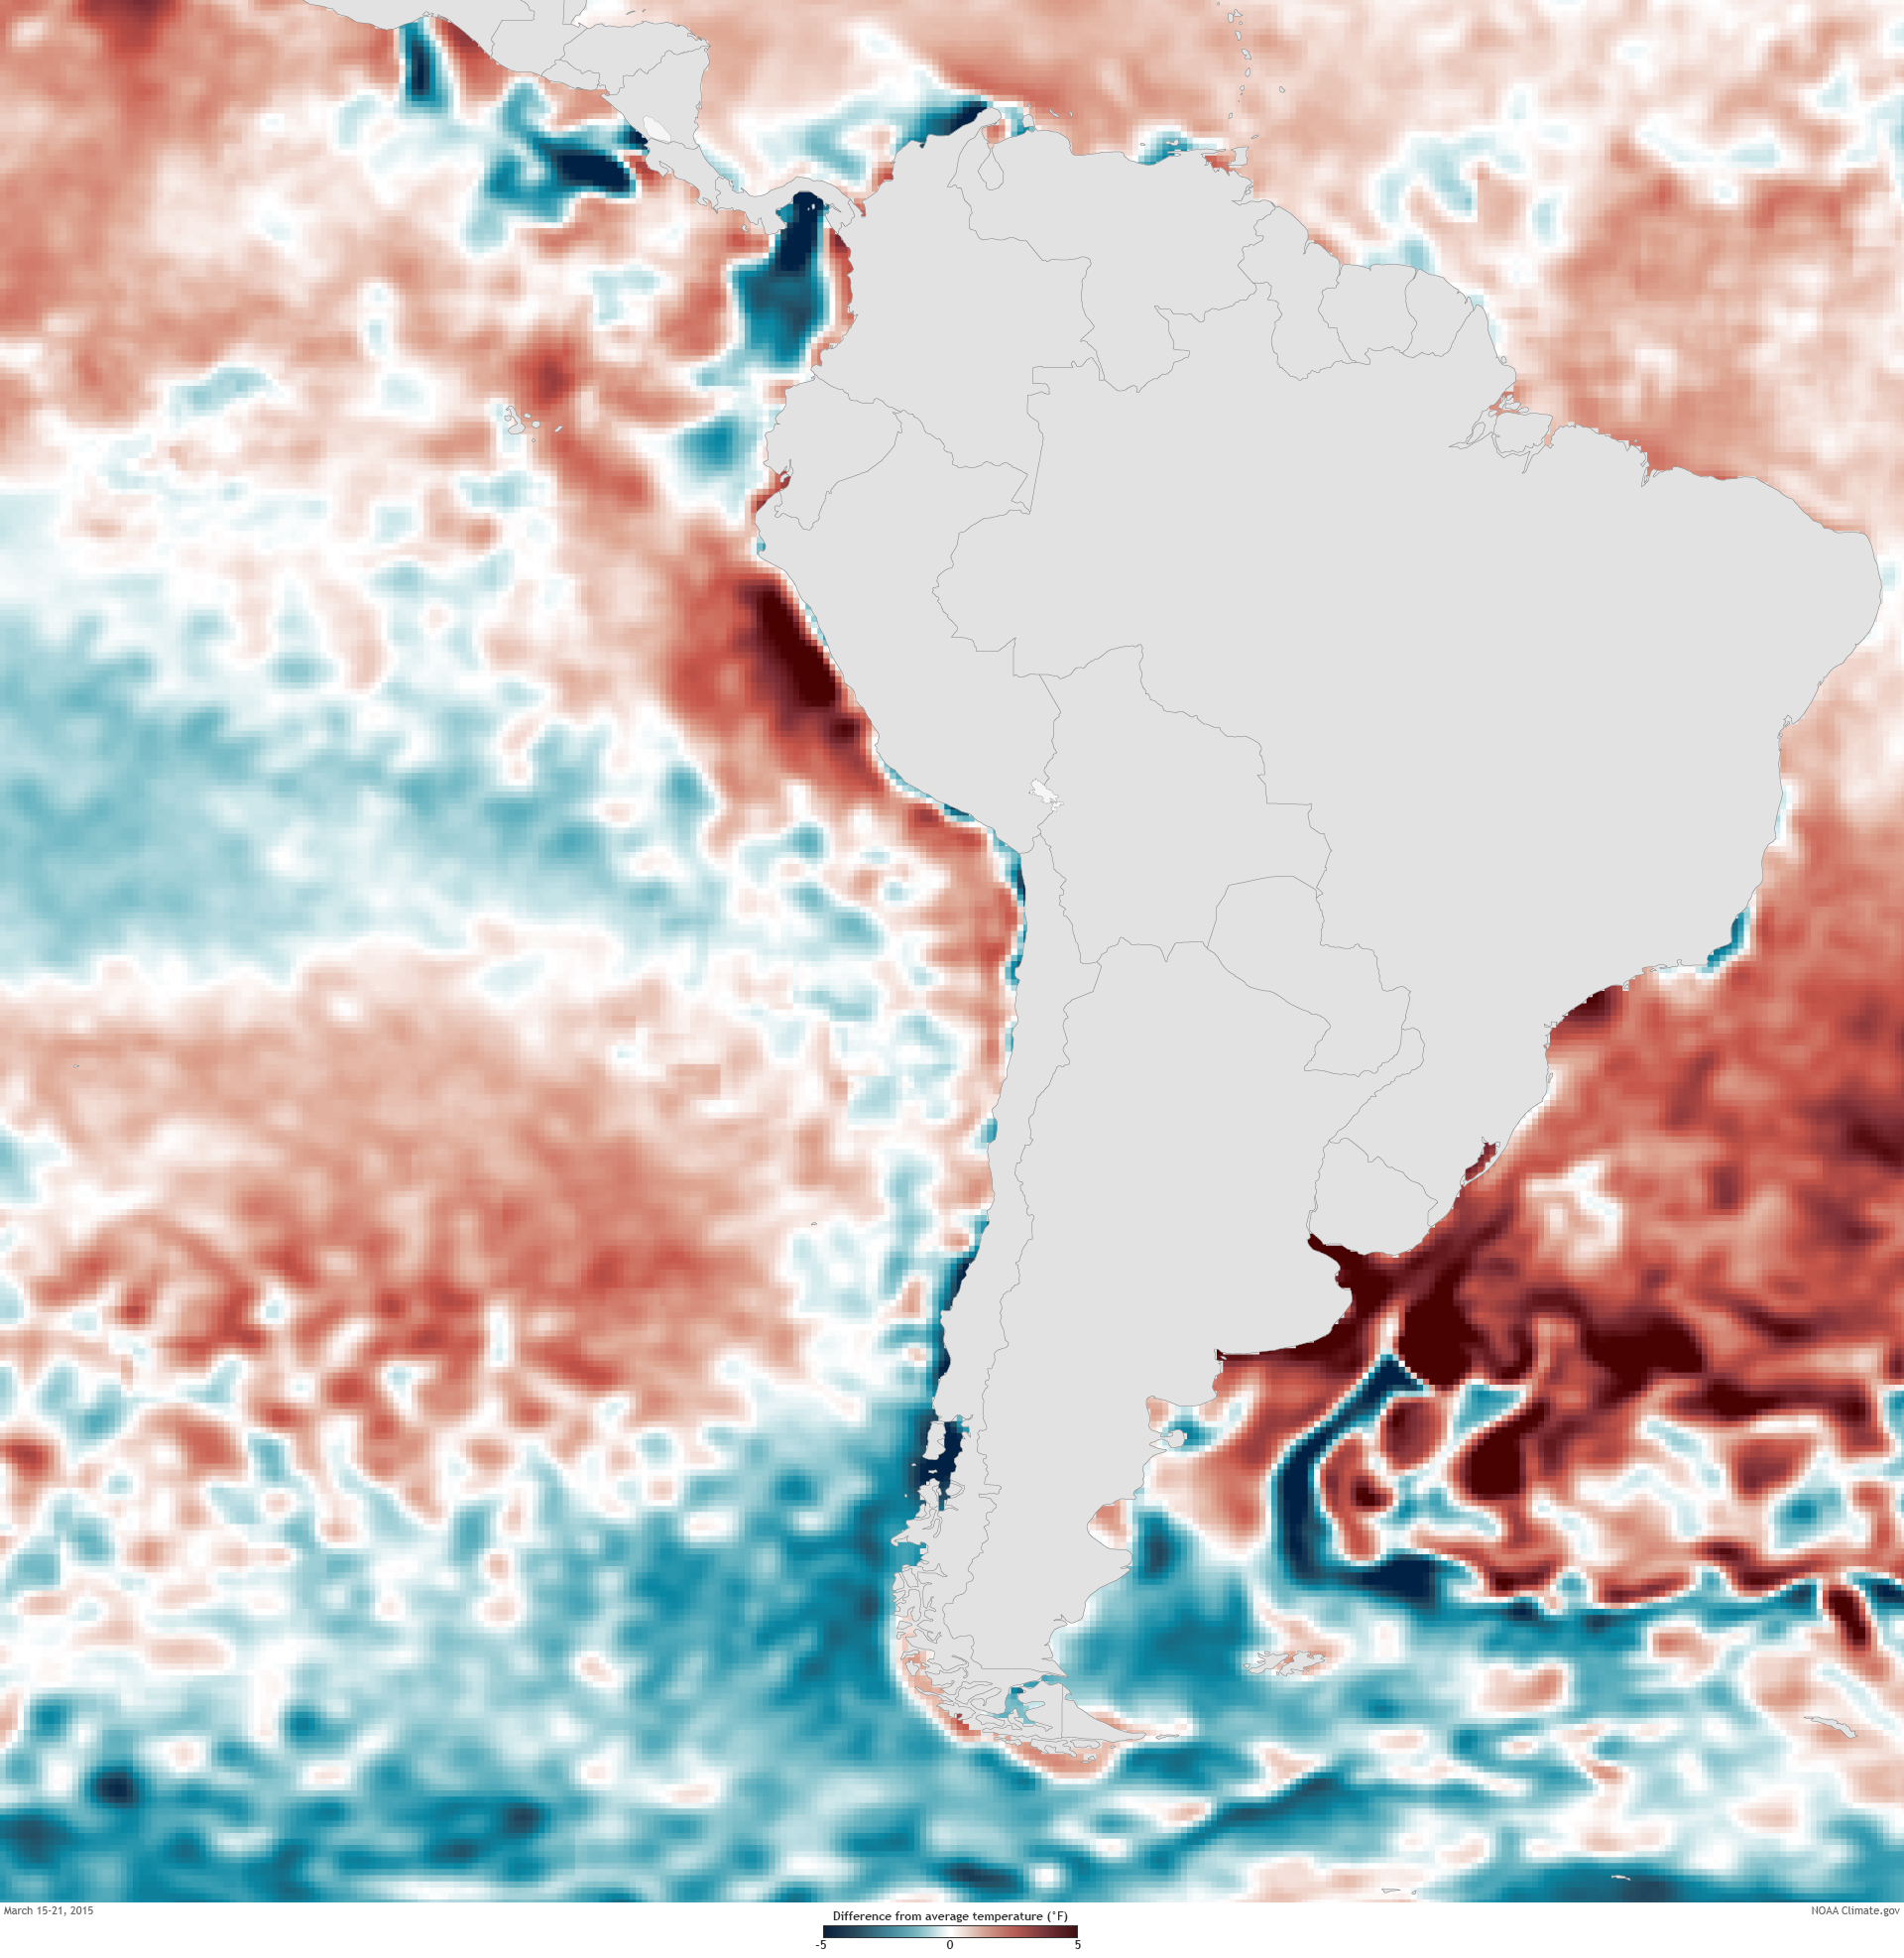
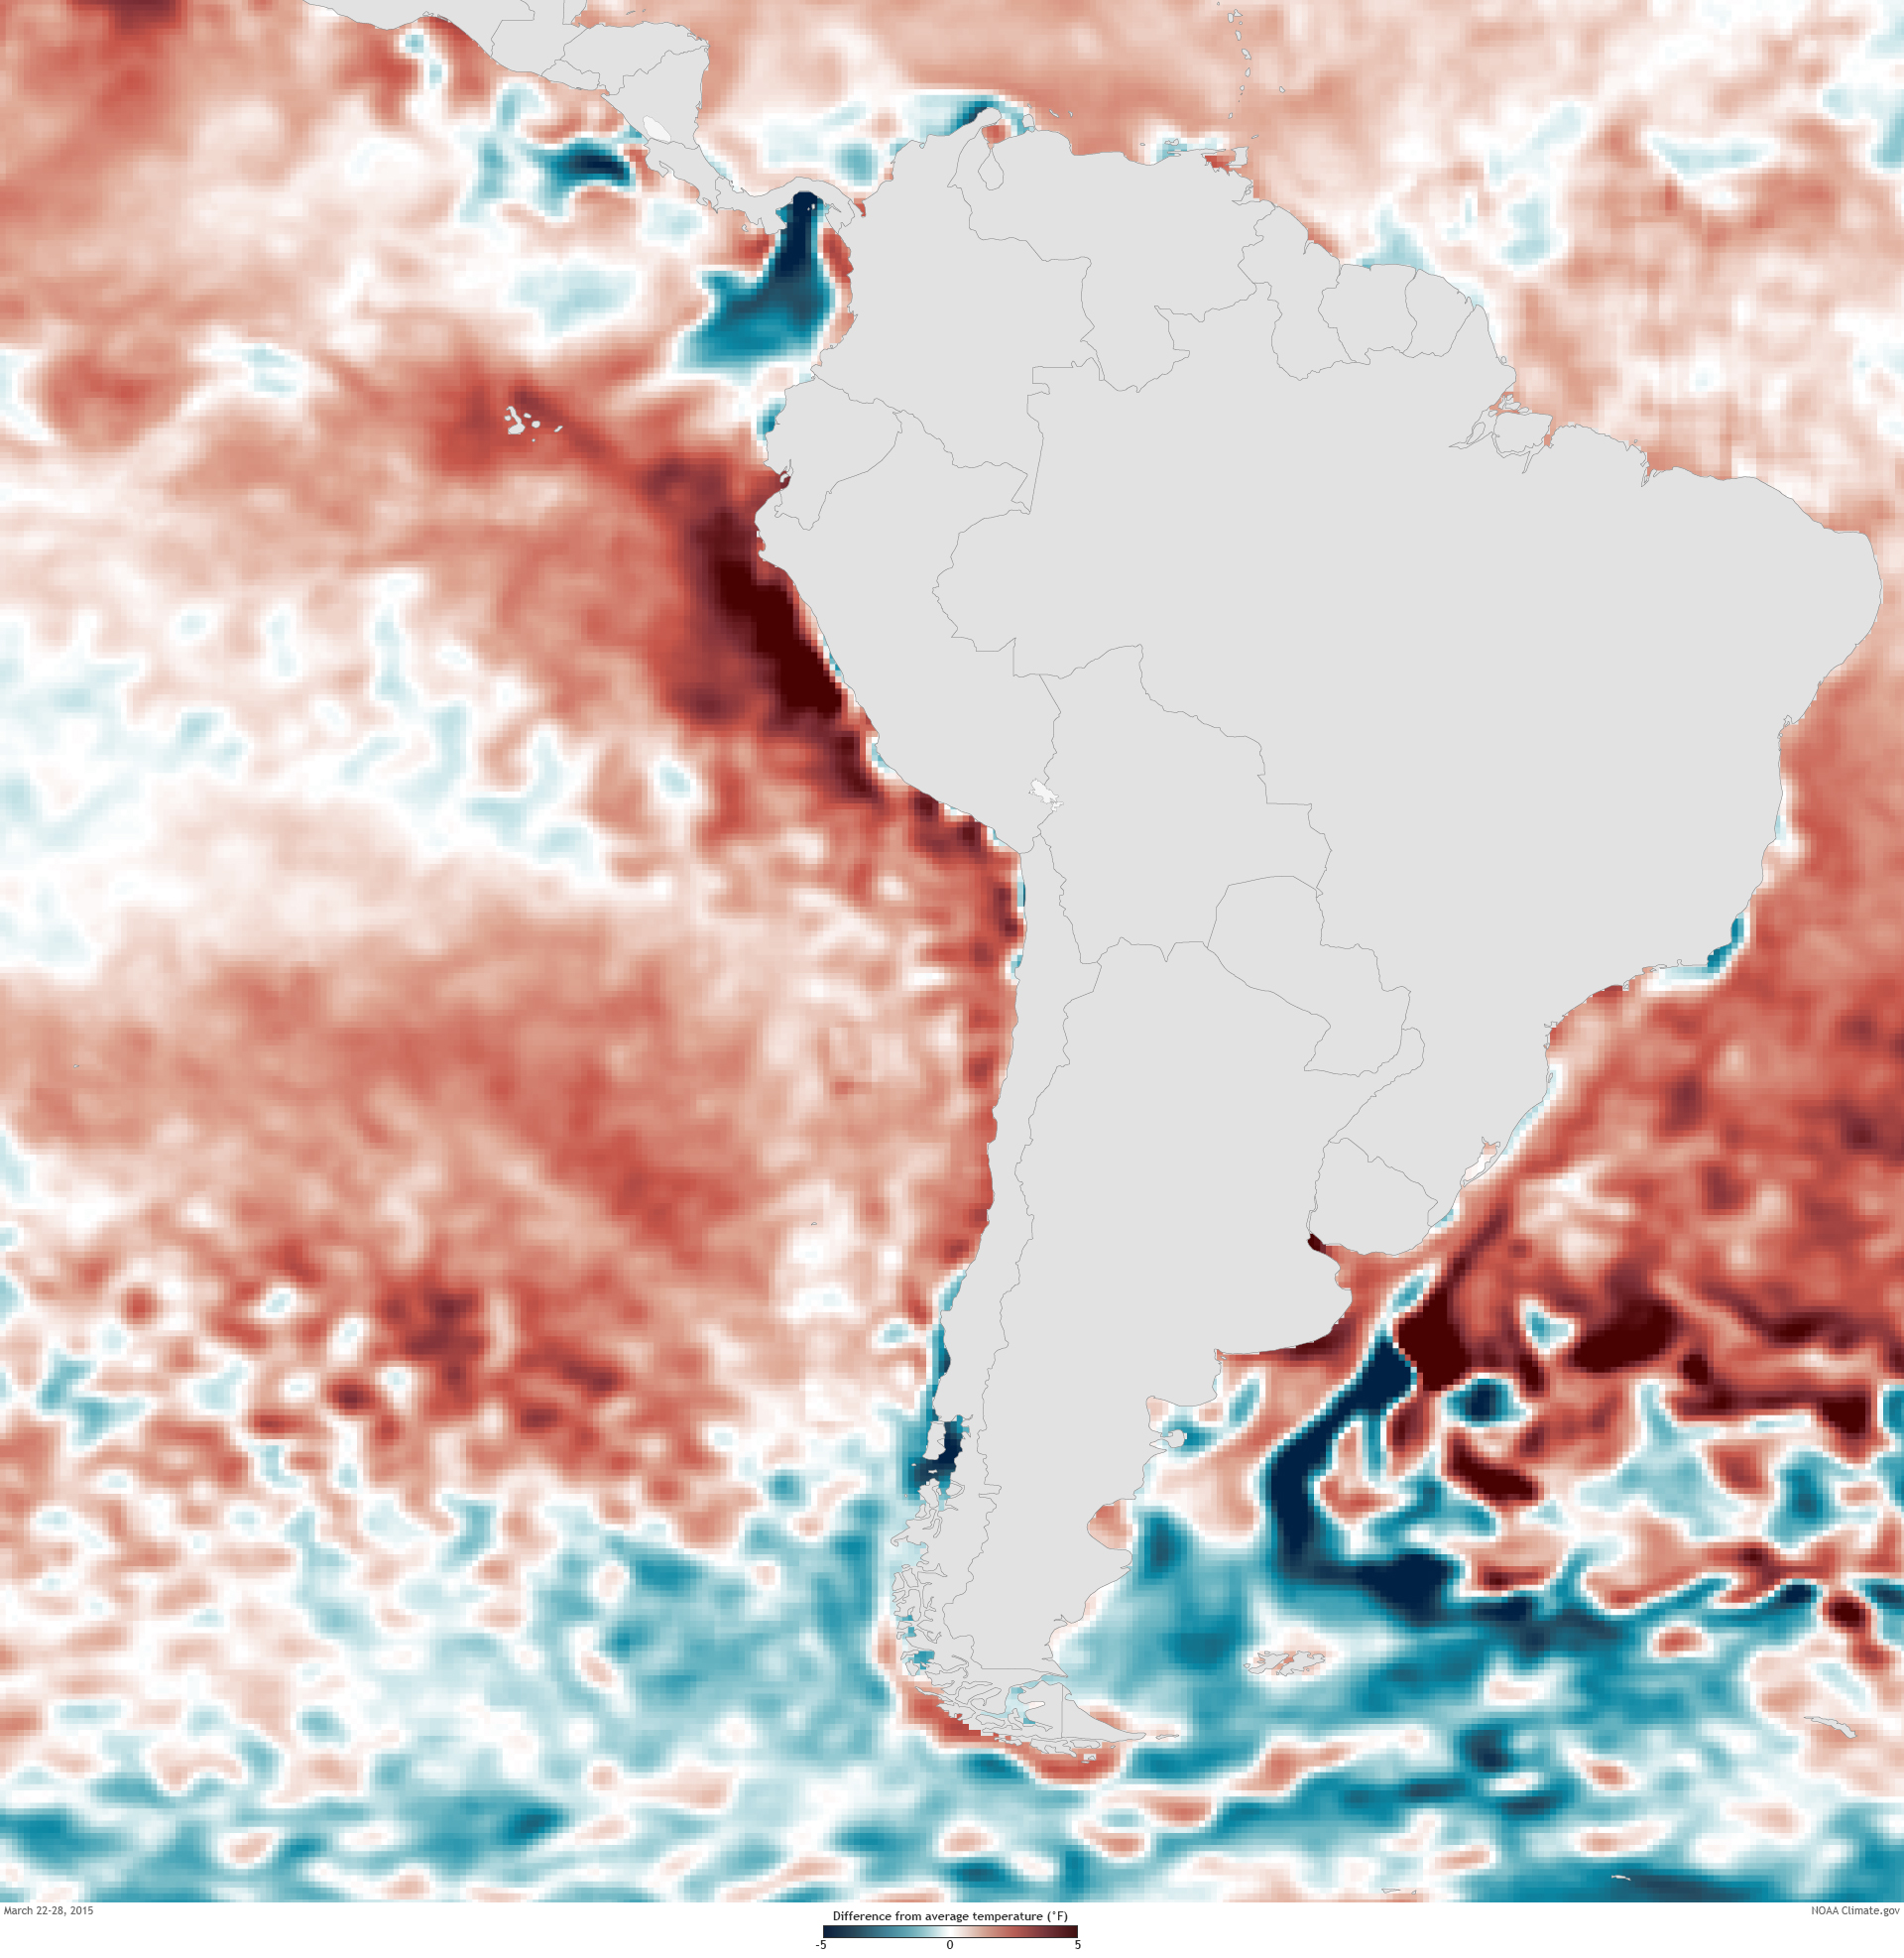
Difference from average sea surface temperature for the third and fourth week of March 2015. Increased evaporation due to rapid warming in the eastern tropical Pacific boosted the moisture available to the cut-off low pressure system over the Atacama Desert. NOAA Climate.gov image based on NOAA OISST sea surface temperature data.
large week 15-21 average image | large week 22-28 average image