File name: Fig3_NAOmap.png
Original Resolution: 863 × 767
File Size: 193 KB (MIME Type: image/png)
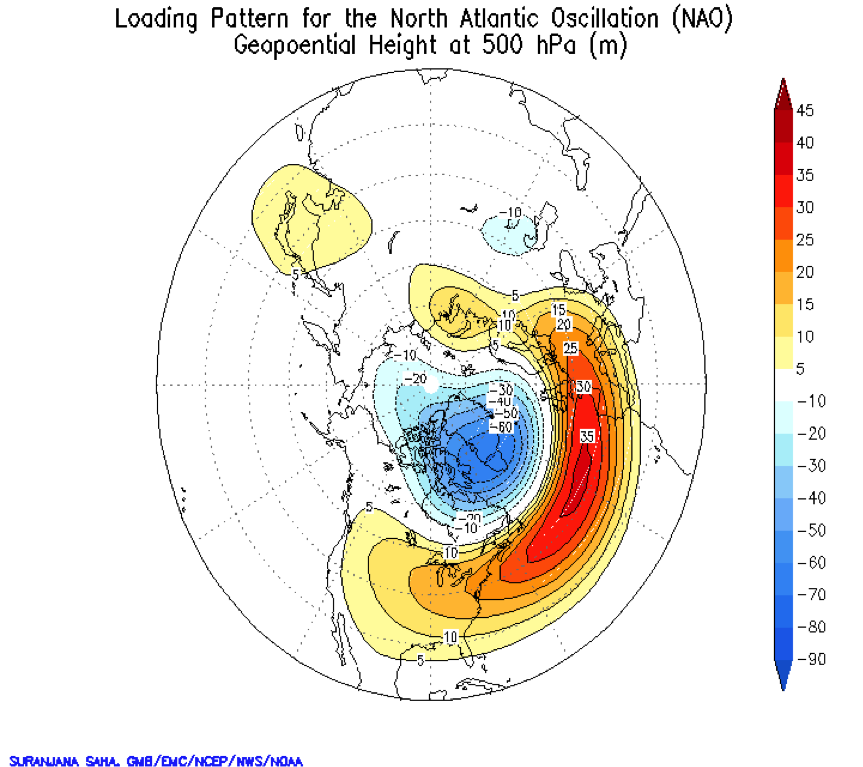
Map showing upper atmospheric pressure anomaly pattern of the North Atlantic Oscillation in its positive phase, using the statistical technique of rotated principal components analysis, which defines typical preferred anomaly patterns. The units are height (meters) of the 500mb pressure surface (higher heights indicate higher pressure at a given altitude above the surface). Image credit: NOAA Environmental Modeling Center.