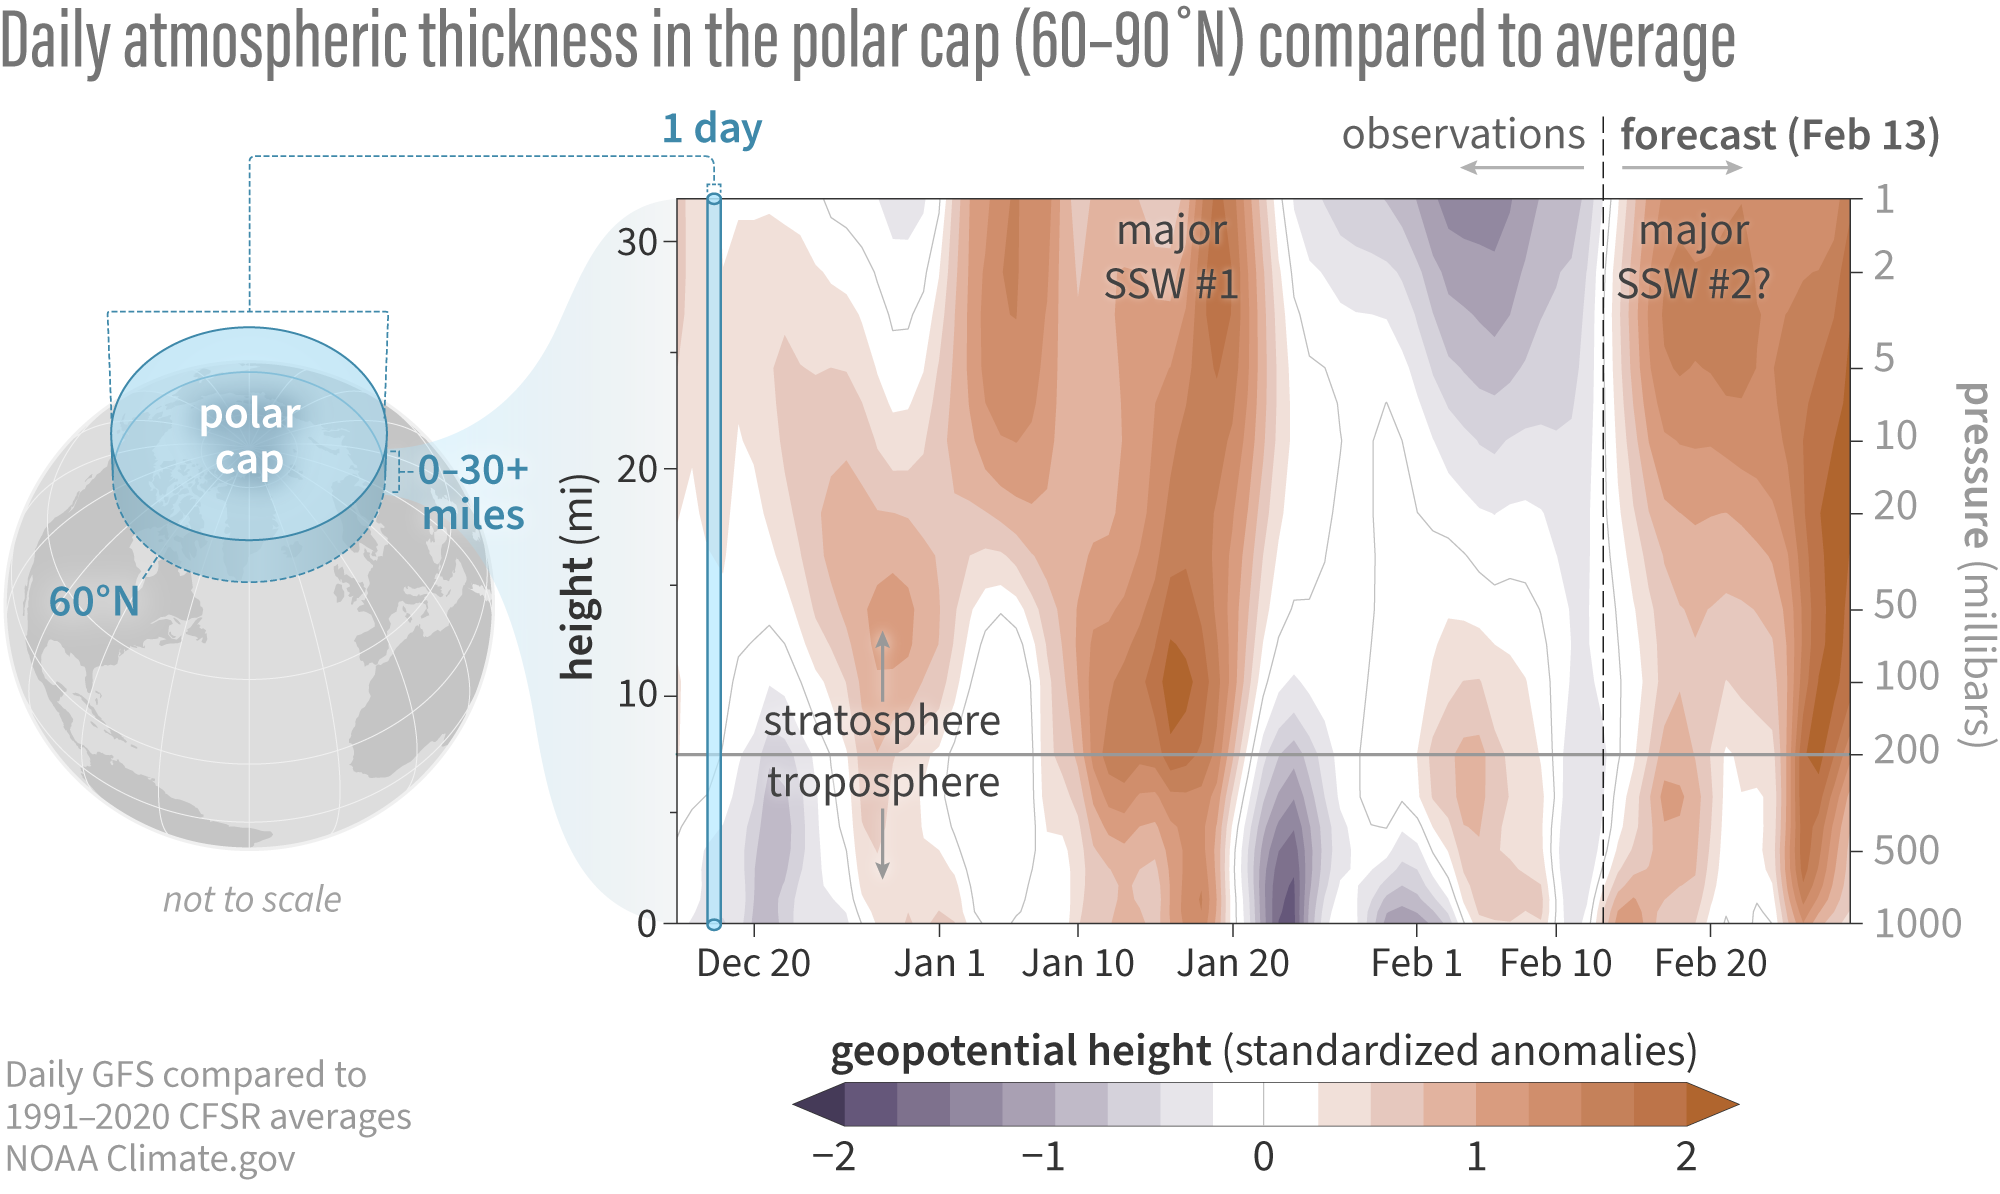
Differences from average atmospheric thickness (standardized geopotential height anomalies) in the column of air over the Arctic from the troposphere to the stratosphere since early December 2023. Since the beginning of February, the troposphere seems to have been uncoupled from the simultaneous conditions directly above in the stratosphere: lower-than-average thickness in the high stratosphere (purple), higher-than-average thickness near the surface (orange). But the recent positive thickness anomalies may be linked to what happened in the stratosphere in mid January. Based on the Global Forecast System (GFS) model, the stratosphere and troposphere are forecast to team up again in the next few days, as the positive height anomalies (orange areas) extend throughout the atmosphere. NOAA Climate.gov image, adapted from original by Laura Ciasto.