
Image caption
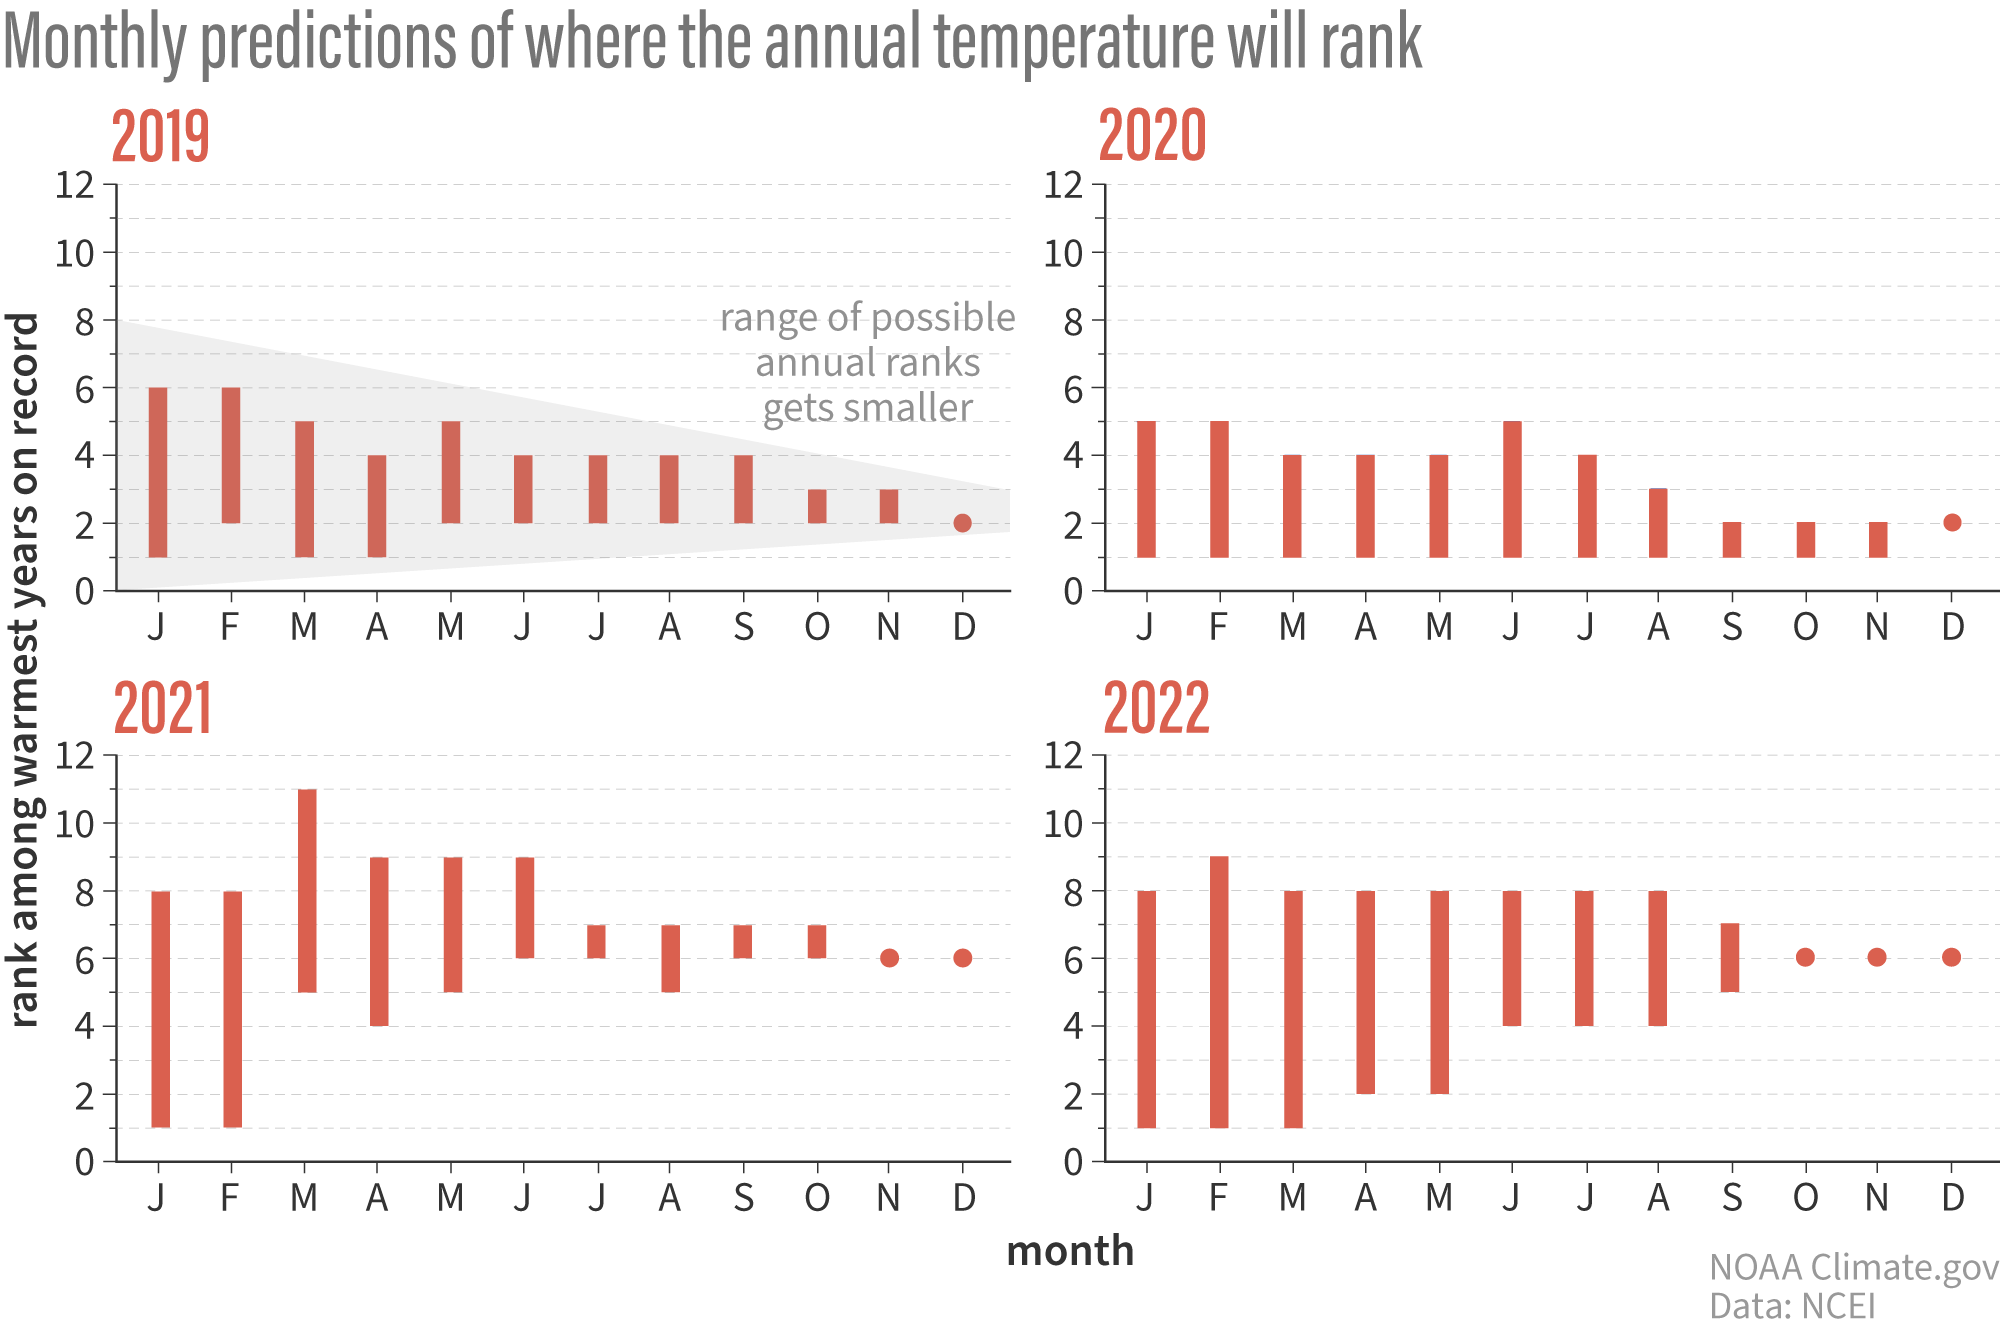
Predicted rank for global temperature by month for 2019-2022. At the start of each year, more possibilities for the eventual rank exist (taller bars indicating wider possible ranges). Because there is a limit to how much the global temperature anomaly can vary from from to month, the range of possible ranks narrows as the year progresses. In 2022, the predicted rank didn't change after September. Climate.gov image, adapted from NOAA NCEI.