
Image caption
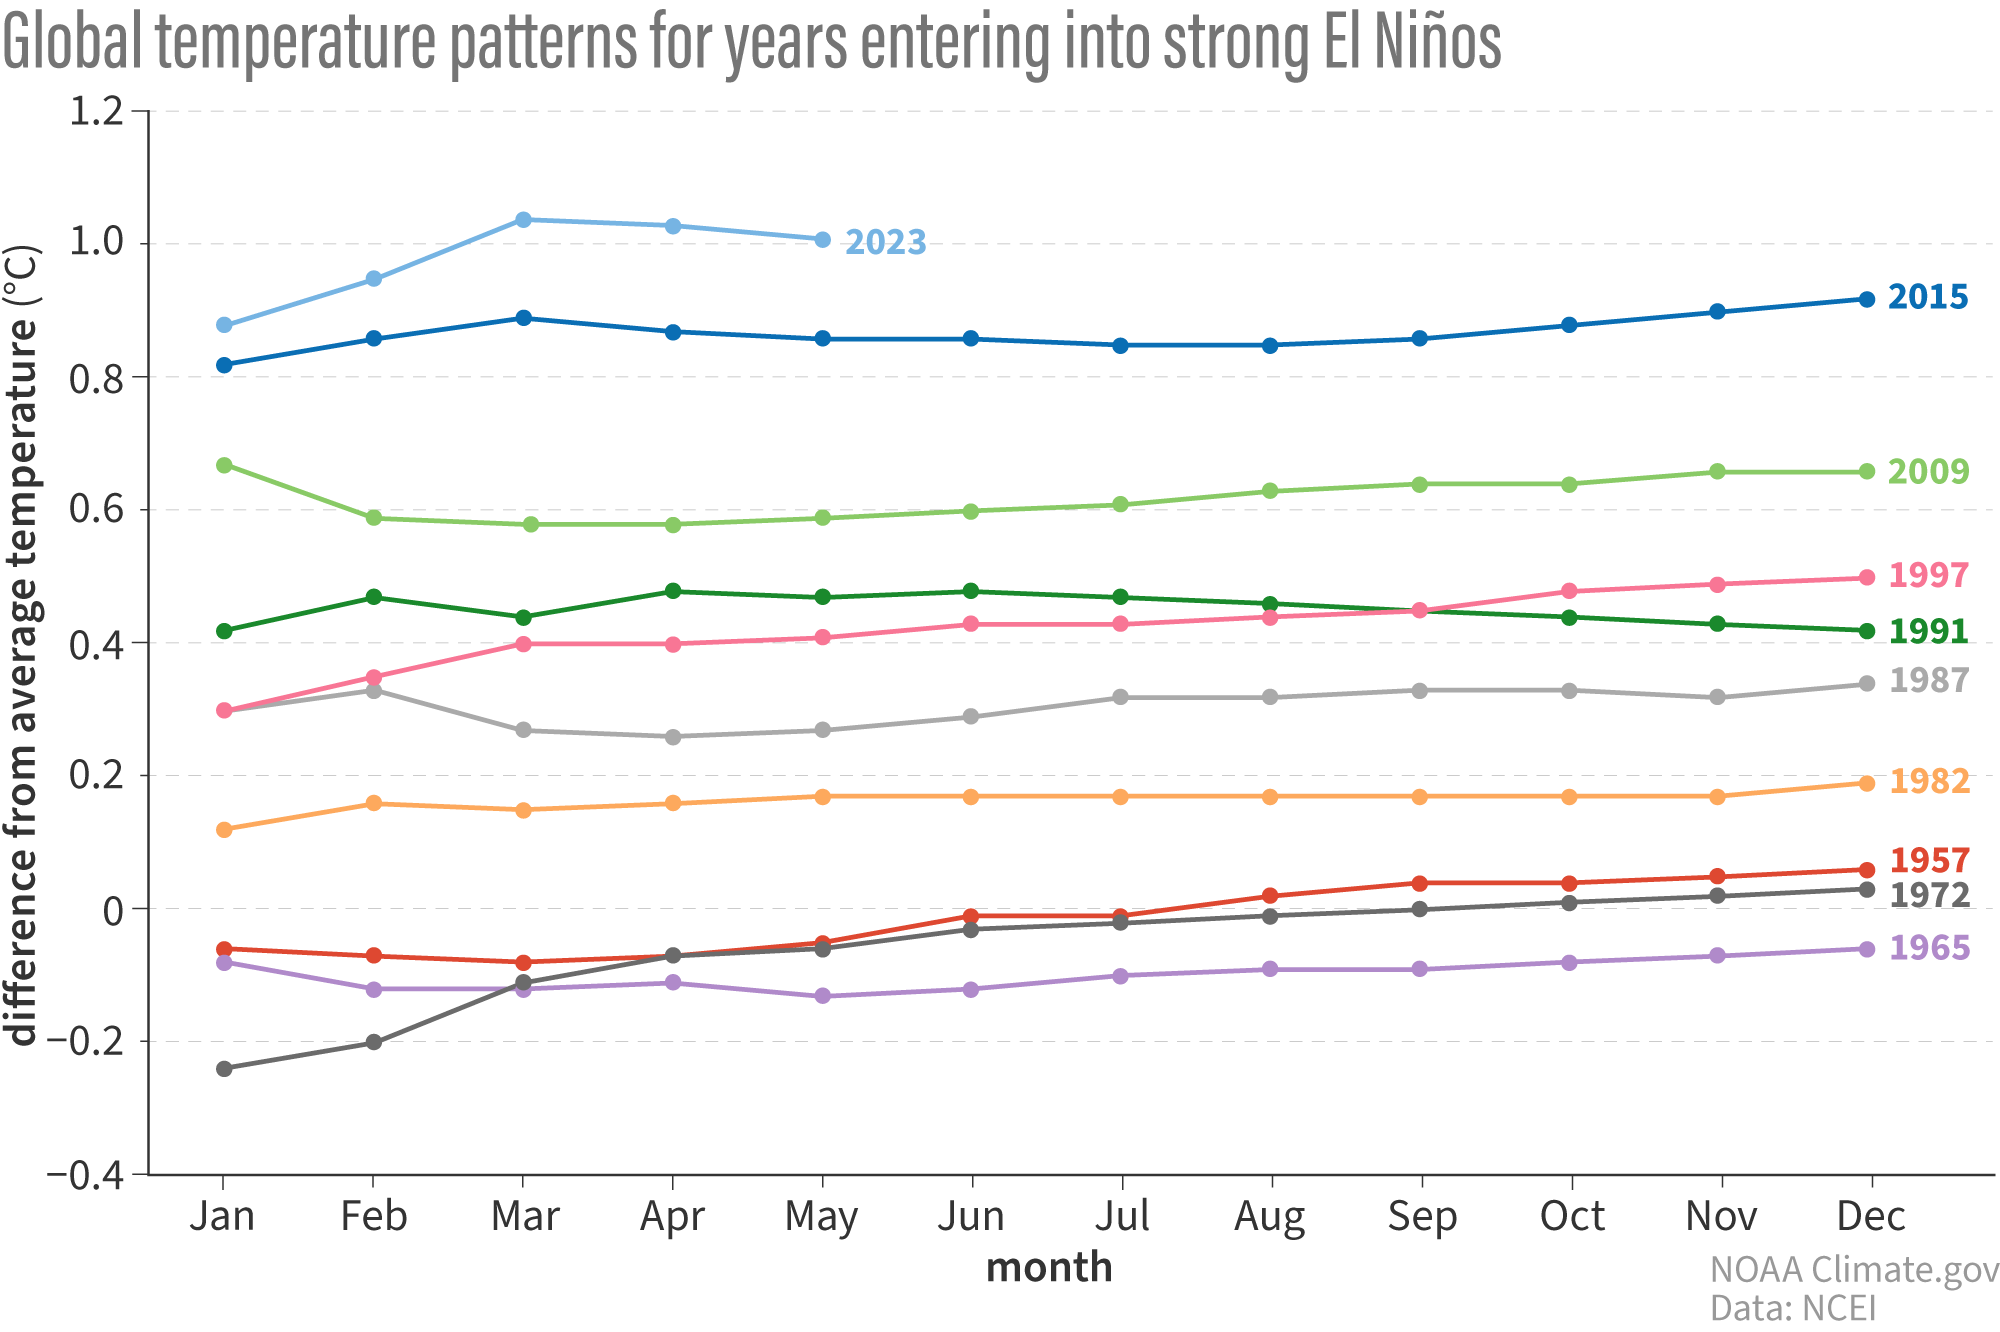
Difference from average temperature for the year to date (by month) for 2023 (top line, light blue) and all other years where a strong El Niño developed in the second half of the year. During all past years except 1991, the year-to-date temperature anomaly in mid-year held steady or increased as the year progressed. Based on that pattern, the final 2023 average anomaly is unlikely to be smaller than the year-to-date as of May. On that trajectory, 2023 would eventually tie 2020 for second-warmest year on record. NOAA NCEI image.