File name: ENSOblog_20210715_SST-maize-yield-anomalies_large.png
Original Resolution: 1200 × 1200
File Size: 635 KB (MIME Type: image/png)
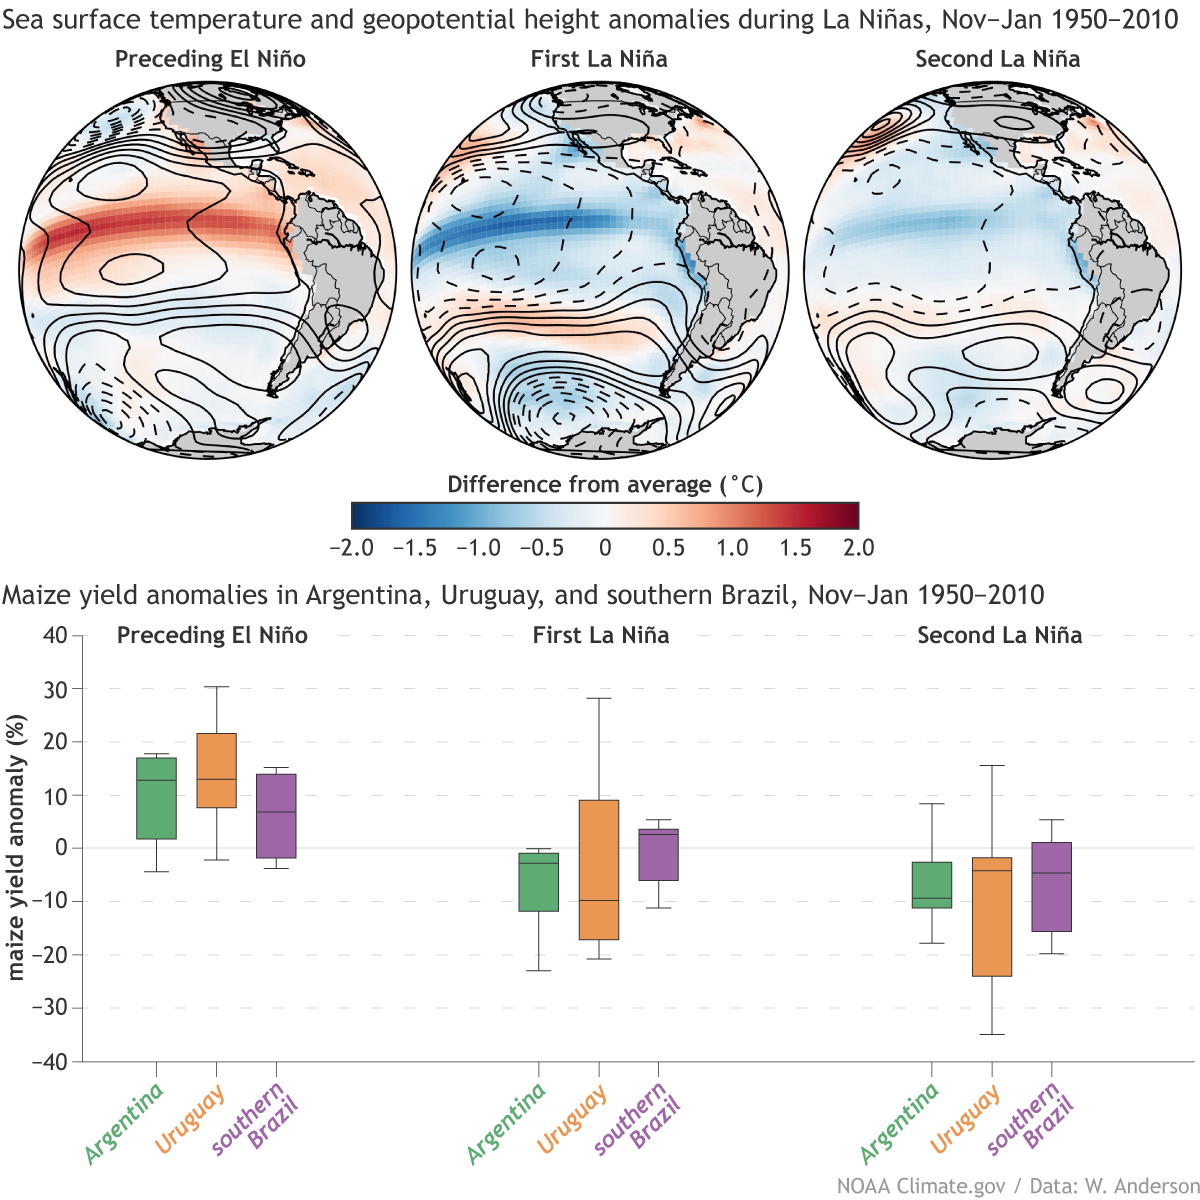
Average observed sea surface temperature and geopotential height anomalies for Nov-Jan during La Niñas, which tend to be preceded by El Niños and followed by weaker La Niña-like conditions, for the years 1950-2010 (top panel). Corresponding maize yield anomalies, expressed as percent deviations from the long-term trend, in Argentina, Uruguay, and Southern Brazil (Paraná, Santa Catarina, and Rio Grande do Sul). Figure provided by Weston Anderson and modified by climate.gov.