File name: blogERSSTv5May21_620.png
Original Resolution: 620 × 393
File Size: 45 KB (MIME Type: image/png)
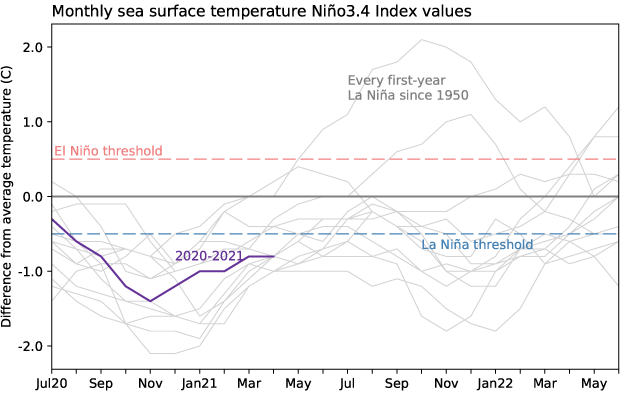
Monthly sea surface temperature in the Niño 3.4 region of the tropical Pacific for 2020-21 (purple line) and all other years starting from first-year La Niña winters since 1950. Graph by Emily Becker based on ERSSTv5 temperature data.