Early disappearance of winter snowpack can have a major impact on spring and summer water supplies for people, ecosystems, and agriculture.
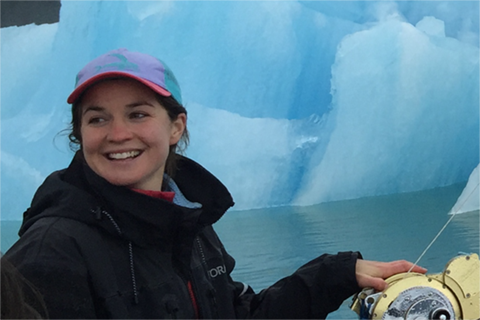
To better predict sea level rise, Rebecca Jackson wants to describe exactly what happens where liquid ocean meets the icy underside of glaciers. But how do you study a glacier that could calve a dangerous iceberg at any moment?
Existen evidencias científicas abrumadoras de que la Tierra se está calentando y una preponderancia de pruebas científicas de que las actividades humanas son la causa principal.
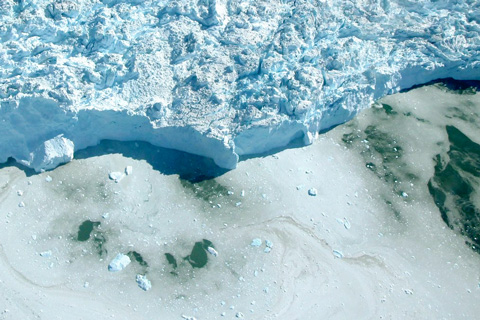
Between September 2019 and August 2020, the rate of ice loss from the Greenland Ice Sheet was much lower that the record set the previous 12-month period, but but still above the 2002–2020 average. Overall, Greenland continues to lose ice.
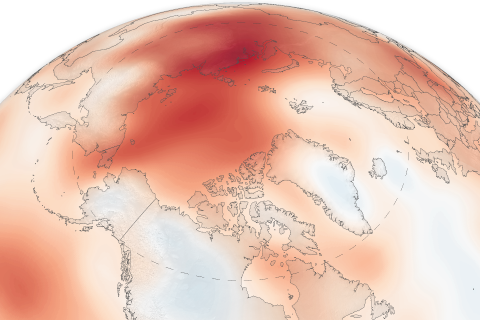
The 15th installment of NOAA's Arctic Report Card NOAA's 15th Arctic Report Card catalogs the numerous ways that climate change continues to disrupt the polar region.
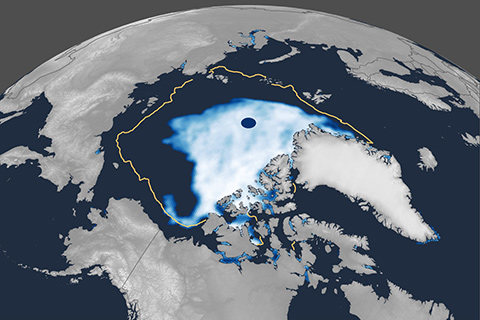
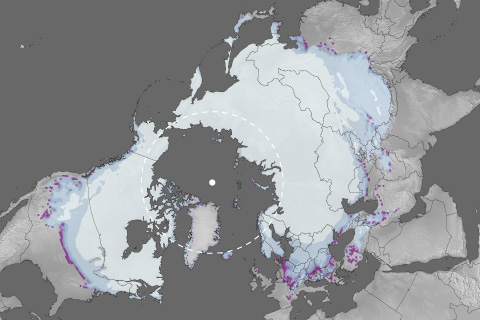
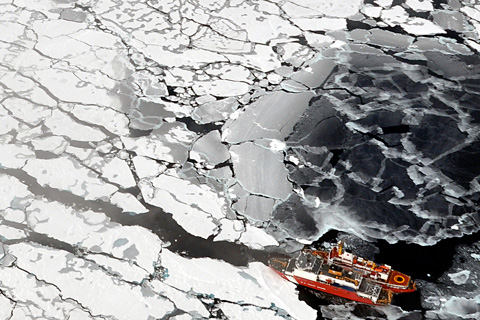
Arctic sea ice extent likely reached its annual minimum for 2020 on September 15. For the second time in the satellite record, sea ice extent dipped below 1.5 million square miles (4 million square kilometers).
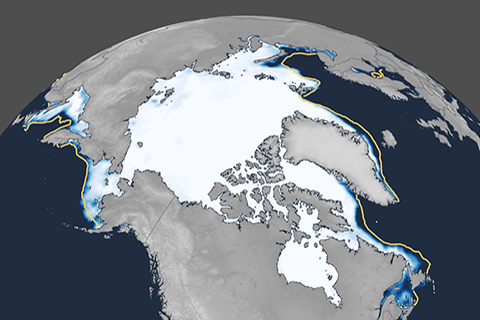
Arctic sea ice extent reached its apparent annual maximum on March 5, 2020. It was the 11th-lowest maximum in the 42-year satellite record. Though nowhere near a record low, it was well below the 1981–2010 average.
A new crop of studies funded by NOAA's Climate Program Office explores a range of questions about sea ice forecasting, including one of the most basic: how far ahead is it even possible to predict it?
NOAA’s 14th Arctic Report Card recounts the numerous ways that climate change continues to disrupt the polar region, including massive melt of the Greenland ice sheet and major shifts in the distribution of commercially valuable marine species.
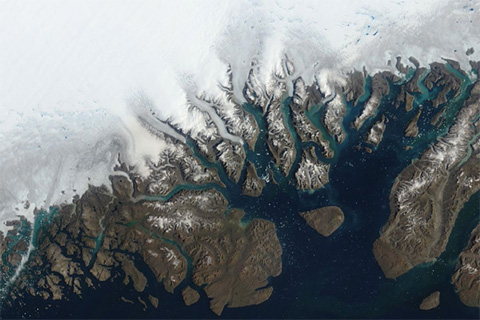
Under high pressure and sunny skies, roughly 95 percent of the surface experienced melting at some point in the summer, well above the 1981-2010 average of about 64 percent, equivalent to the previous record set in 2012.