It's official: March 2012 warmth topped the charts
Record and near-record breaking temperatures dominated the eastern two-thirds of the nation and contributed to the warmest March for the contiguous United States since records began in 1895. More than 15,000 warm temperature records were broken during the month. The average temperature of 51.1°F was 8.6 degrees above the 20th century average. In the past 117 years, only one month (January 2006) has ever been so much warmer than its average temperature.
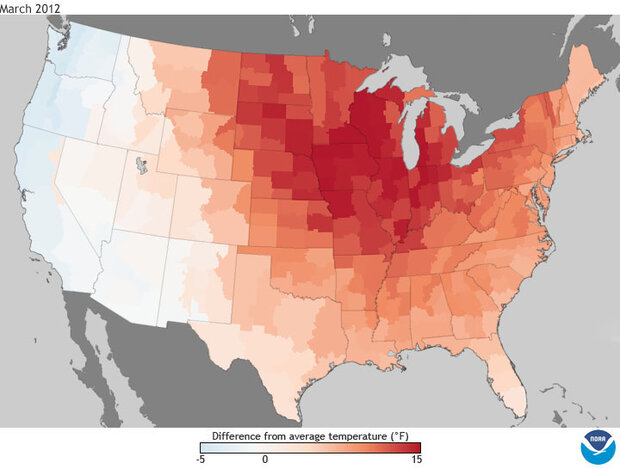
The map above shows where temperatures in the United States were up to 15 degrees Fahrenheit warmer (darkest red) or 5 degrees cooler (blue) than the 1981-2010 average. Maps by climate.gov team based on climate division data from the National Climatic Data Center.
Every state in the nation experienced at least one record warm daily temperature during March. According to preliminary data, there were 15,272 warm temperature records broken (7,755 daytime records, 7,517 nighttime records). Hundreds of locations across the country broke their all-time March records. There were 21 instances of the nighttime temperatures being as warm, or warmer, than the existing record daytime temperature for a given date.
#}Locations of each of the 7,793 daytime and 7,493 nighttime broken or tied temperature records set in March 2012. Animation by NOAA’s Environmental Visualization Laboratory, based on data from the National Climatic Data Center.
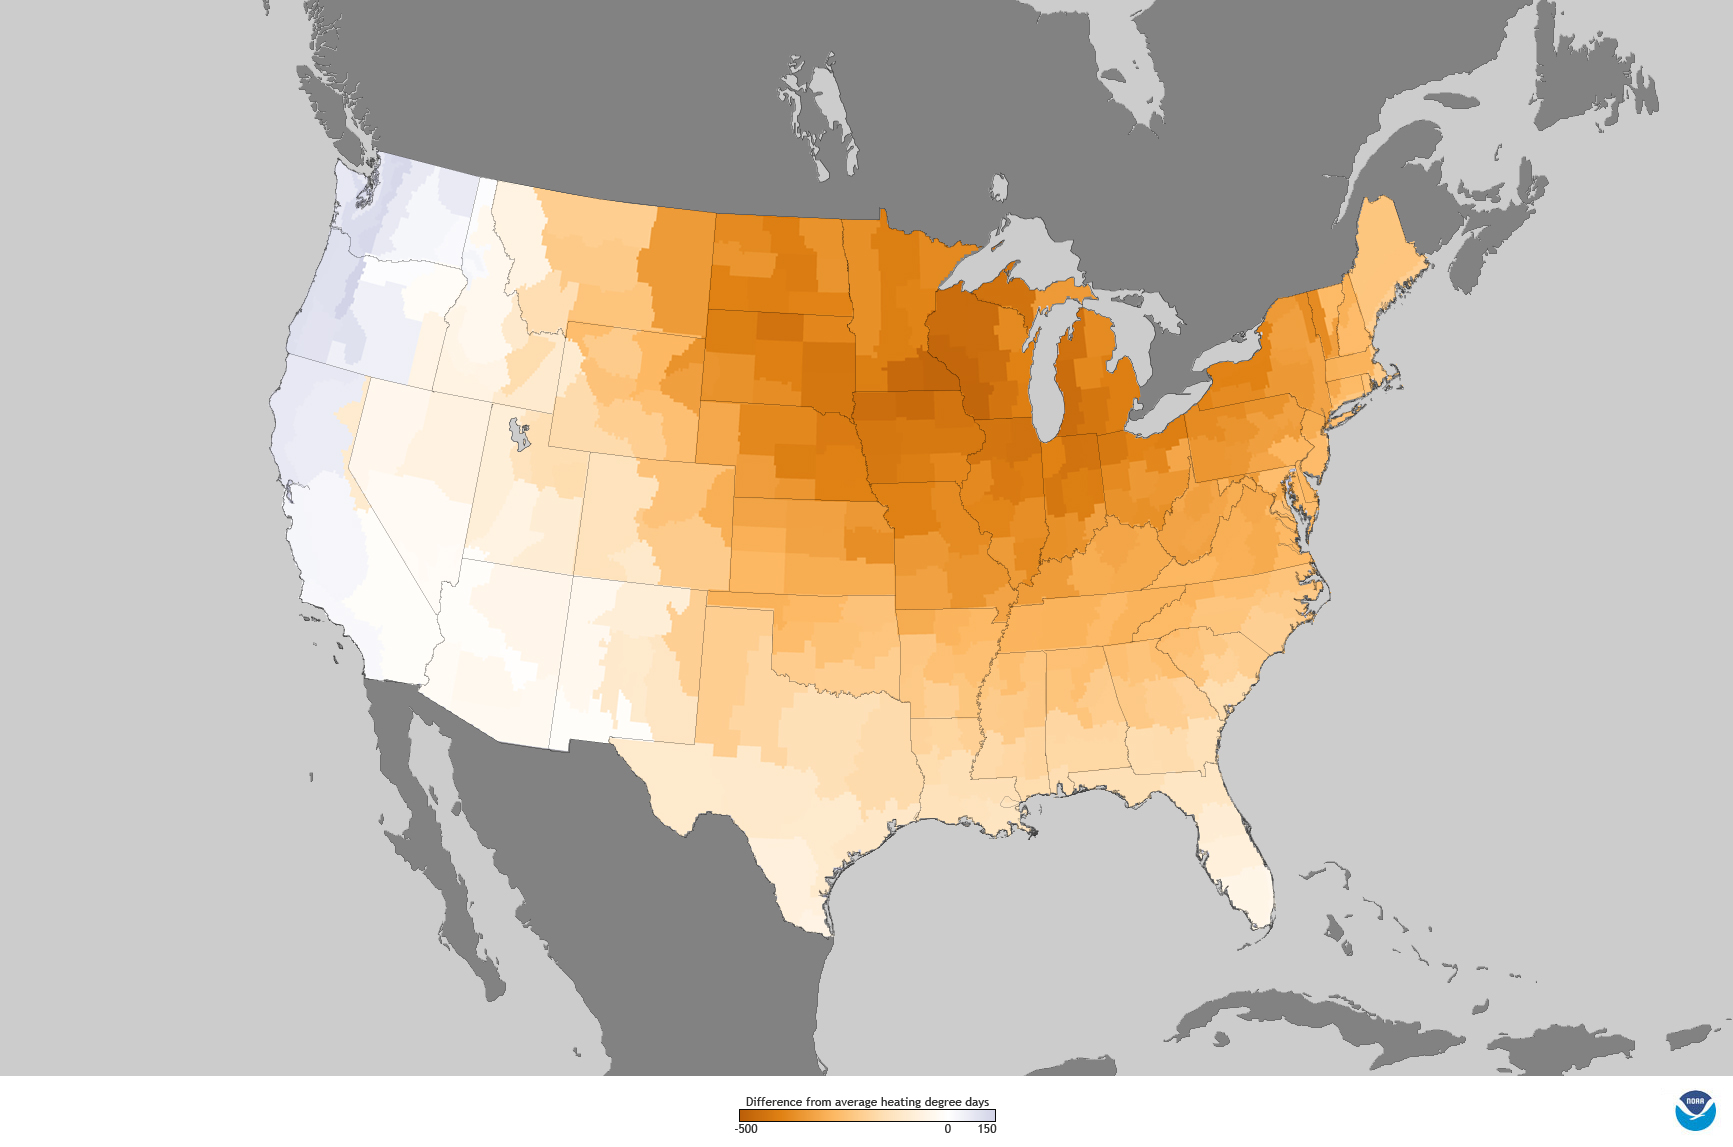
March marks the official end of the U.S. cold season, which spans the previous 6 months. The recent cold season was second warmest on record for the contiguous U.S, with a nationally-averaged temperature 3.8°F above average. Twenty-one states across the Midwest and Northeast, areas of the country with high annual heating demands, were record warm for the six-month period. The warmth contributed to a record-high surplus of U.S. natural gas in storage in early March, according to the U.S. Energy Information Administration update of March 6.
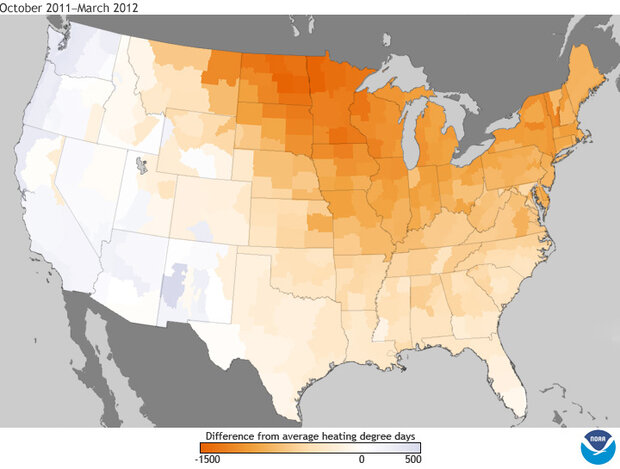
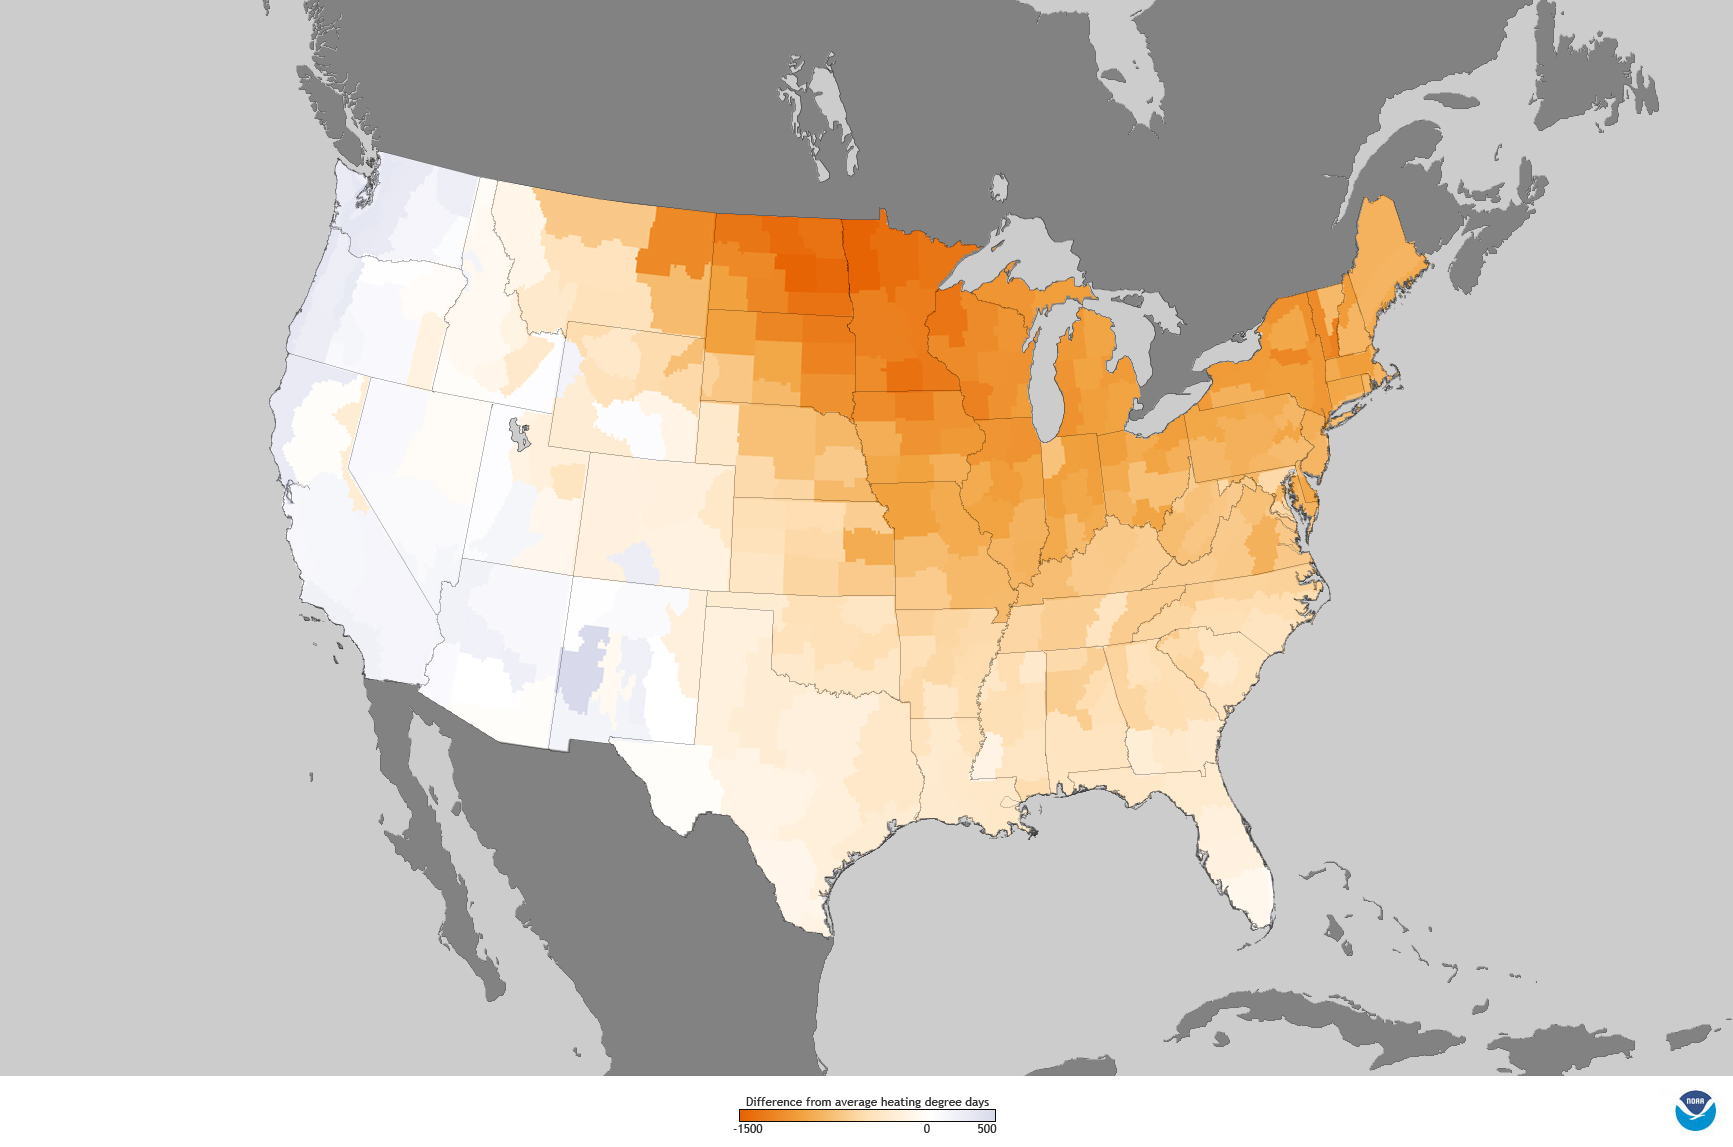
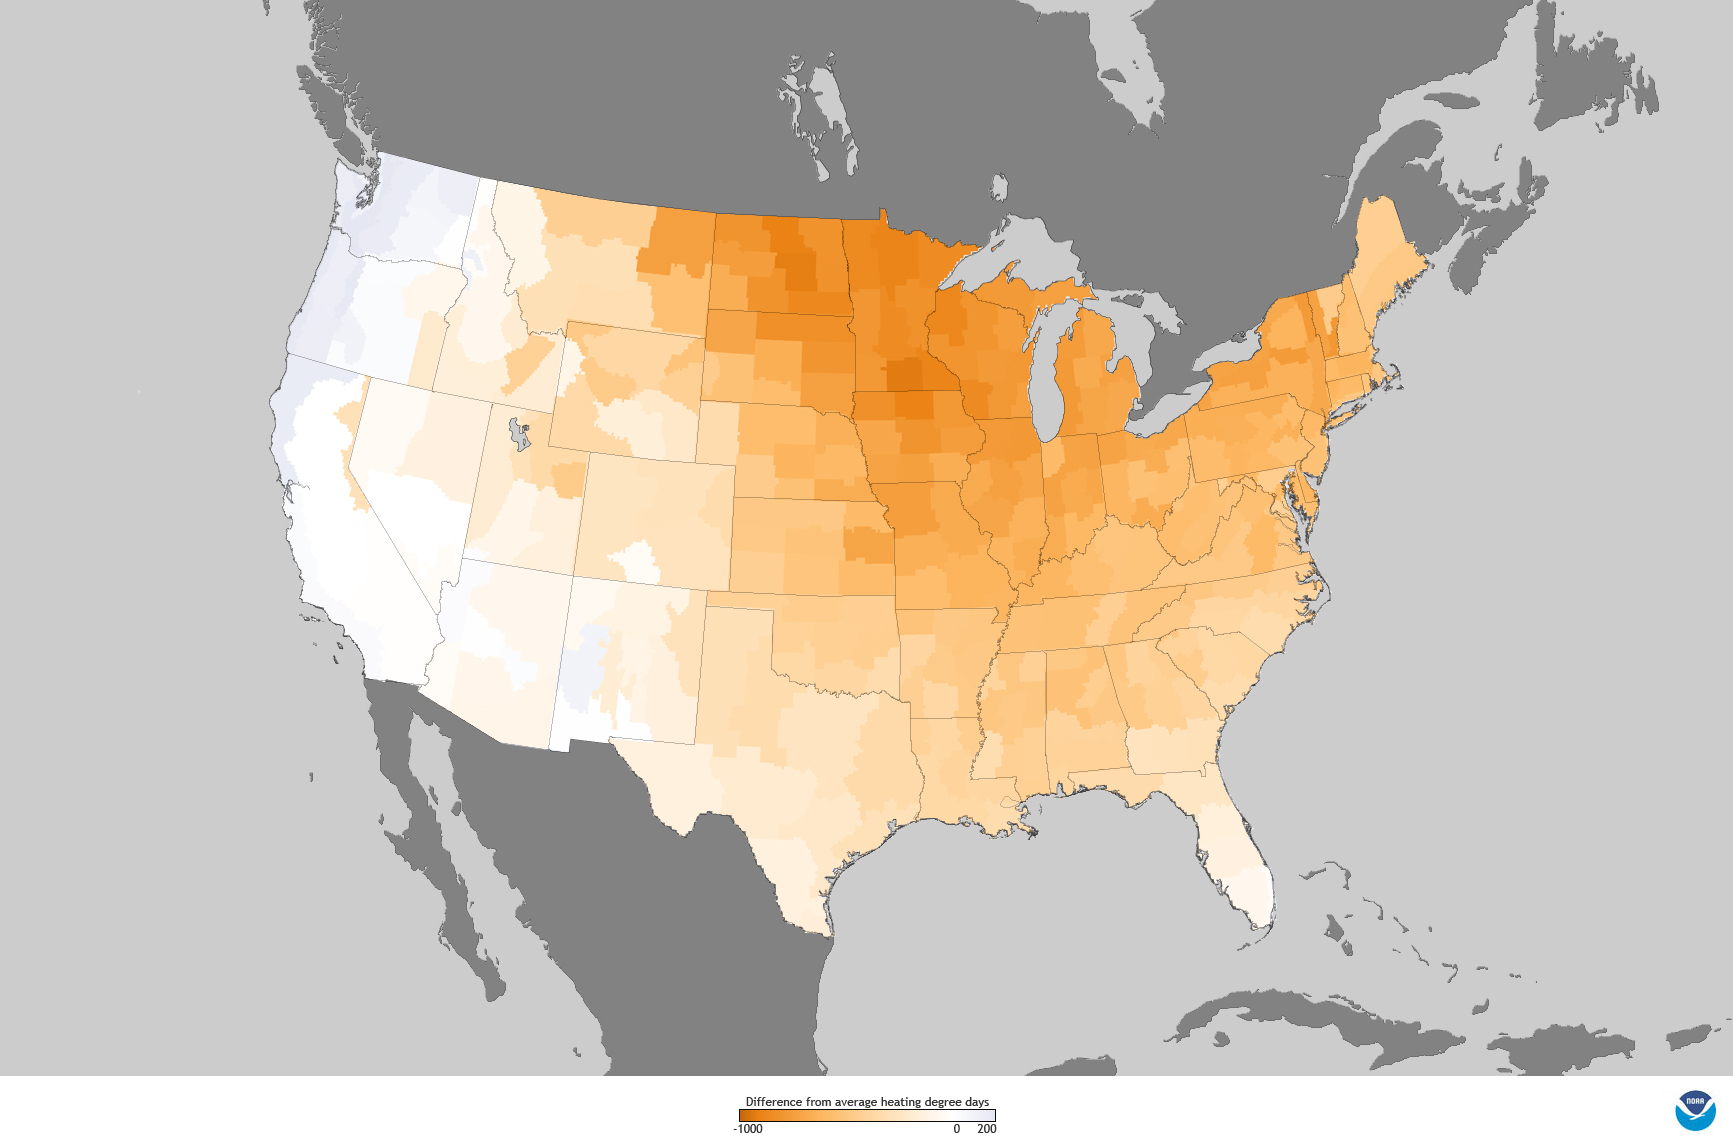
Winter (October 2011-March 2012) heating demand in the U.S compared to the 1981-2010 average heating degree days. Heating degree days describe where daily temperature were above (orange) or below (blue) a 65-degree Fahrenheit baseline. The warmer-than-usual winter meant fewer heating degree days across much of the U.S. Maps by climate.gov team based on data from the National Climatic Data Center. large maps: winter | year to date | March 2012
Meanwhile, the nationally-averaged precipitation total was 2.73 inches, which is 0.33 inches above average. The Pacific Northwest and the Southern Plains were much wetter than average during March while drier-than-average conditions prevailed in the interior West, Northeast, and Florida. Colorado had its driest March on record.
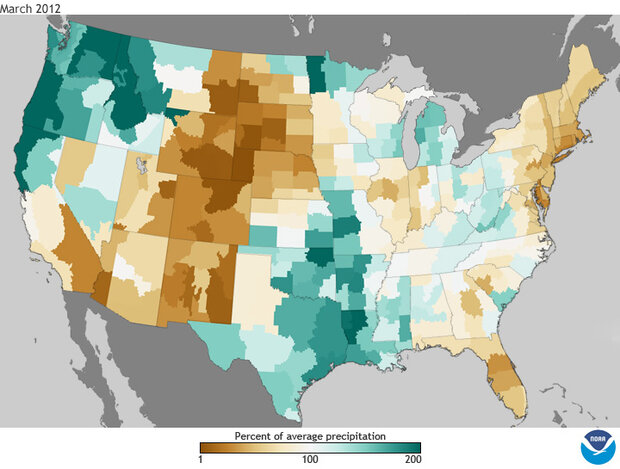
The map above shows where precipitation in the United States was above (blue-green) and below (brown) average in March compared to the 1981-2010 baseline. Maps by climate.gov team based on climate division data from the National Climatic Data Center.
According to the U.S. Drought Monitor, as of April 3rd, 36.8 percent of the contiguous U.S. was in drought, a decrease from 38.7 percent at the end of February and an increase from 28.8 percent a year ago on April 5, 2011. Above-average precipitation across the Southern Plains improved long-term drought conditions Texas, Oklahoma, and Kansas.