Soggy May in the U.S. Southeast steers day and nighttime temperatures in different directions
On June 6th, the National Centers for Environmental Information released the U.S. climate data for May and Spring (March through May) 2018. People and businesses use this information at the granular level to help gauge crop progress or understand sales outcomes or predict HVAC bills. But the national big picture takeaway was clear: this was the warmest May on record for the United States.
There’s a hidden story in May’s climate data. Picking it out is like night and day. No, literally, night and day. Let’s go Beyond the Data.
Historical categories for May 2018 Average Temperature. Warmest/Coldest indicate record May values for that grid point. Much above/below indicate top/bottom 10% of history. Above/Below indicate the upper/lower tercile (one-third) of history. Near Average indicates the middle tercile of history. Each grid point has 124 years of values, dating to 1895.
First things first: May was warm across the board.
May was like most months of the 21st century in that minimum temperatures (“overnight lows”) were relatively warmer compared to normal, than maximum temperatures (“daytime highs”).
There’s certainly a lot more red (record-setting warmth) on the minimum temperature map than the maximum temperature map for May. We’ve talked about this before on Beyond the Data.
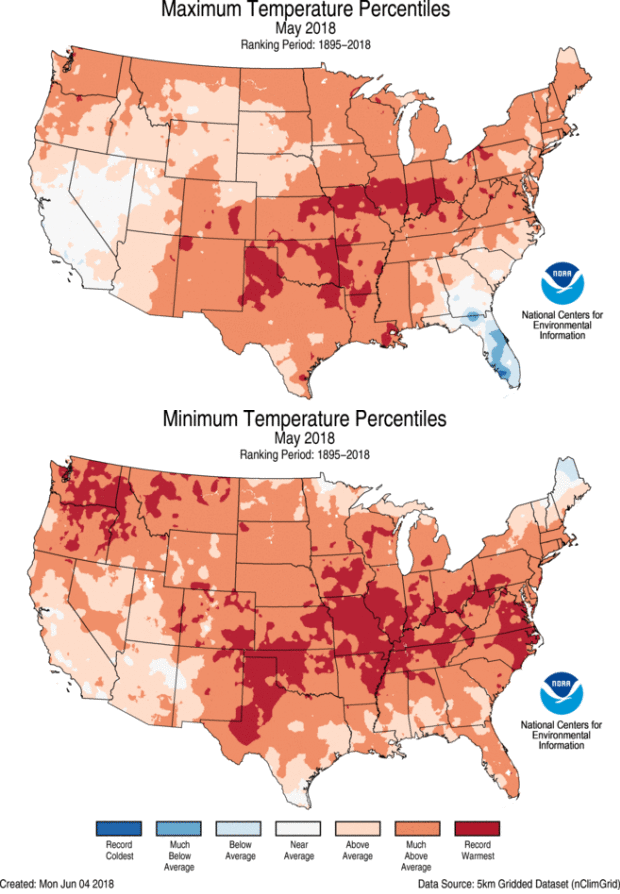
Maximum Temperature (top) and Minimum Temperature (bottom) rank categories for May 2018. The categories use the same convention as before.
But, wow. Look at the Florida peninsula. Its days were on the cold side – in fact, classified as “much cooler than average” or in the bottom 10% of history for parts of the peninsula. A few pixels near Ft. Myers represent coolest-May-afternoons-on-record values.
Now look at the minimum temperature map. Everything is on the warm side—and for most of the state, on the “much warmer than average” or warmest 10% of history.
How can that be? The answer lies in, of all things, the precipitation map for May. Much of Florida and adjacent parts of the Southeast had their wettest May on record or very close to it. Simply put: it rained a LOT between the Appalachians and the Atlantic and Gulf Coasts.
Precipitation rank categories for May 2018. The categories use the same conventions as those for the temperature maps.
Let’s introduce a term here: Diurnal Temperature Range, or DTR. Diurnal is Latin for “daily,” so DTR is a measure of the range between the overnight low and the afternoon high.
In the warm season, and May certainly fits that bill in the South, rainy months typically decrease the DTR. That means afternoon temperatures are suppressed, and nighttime temperatures are elevated.
But how does that happen, physically?
First, all else being equal (pro tip: it never is), surface temperature cycles during the day, and during the year, for that matter, reflect an energy-in-energy-out relationship. When incoming (“downwelling”) energy exceeds outgoing (“upwelling”) energy from the surface, it gets warmer. When outgoing energy exceeds incoming energy, it gets cooler.
During the daytime, it’s easy. Rain comes with clouds, which keep some of the Sun’s energy from striking the surface, which means slower/less daytime heating. Even on sunny days during rainy months, the soil is moist, which means a larger proportion of sunlight striking the ground goes toward evaporating water, versus raising the temperature of the land surface (which then warms the overlying air).
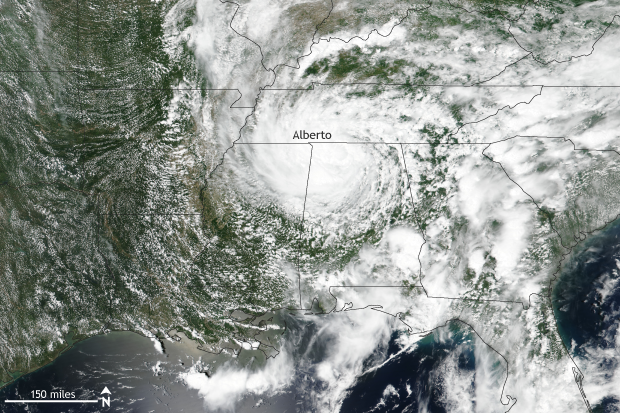
Suomi NPP satellite image taken of the southeast United States on May 29, 2018 using the VIIRS instrument. Subtropical storm Alberto became the first named storm of the 2018 Atlantic Hurricane season during the end of May 2018. Oddly, after making landfall, Alberto became better organized as a storm and was named a tropical depression. NOAA Climate.gov image using data provided by the NOAA Visualization Laboratory.
During the nighttime, the wetness-temperature relationship is less obvious, but still important. A lot of people like to say that clouds “act like a blanket.” Snotty purists (people who would say “diurnal” instead of “daily”) would sneer at say that’s an oversimplification, but the outcome is similar.
Blankets keep you warm by creating a small cocoon of air around your body. Your body radiates heat (outgoing thermal energy), which warms the air, and the blanket prevents that warmed air pocket from floating away.
Clouds provide overnight warming through a different process. Cloud droplets, and especially the water vapor from whence they come, act as an additional barrier to escaping outgoing energy. But not like a blanket, which simply traps warm air. Water vapor is a potent greenhouse gas, which –
Hey, WAIT! DON’T GO! Come back! It’s okay, we can talk about that here. Please, let’s talk.
Water vapor is a potent greenhouse gas, which absorbs heat (outgoing thermal energy) directly. Warmed in the daytime by sunlight, the Earth’s surface radiates heat all night. On a dry, cloud-free night, a lot of that heat just escapes toward space. But on a warmish, humid night, more of that would-be-escaping-to-space heat energy is absorbed by cloud droplets and water vapor. Heat is recycled in the lower atmosphere, keeping things from cooling off as much.
If you bounce back and forth between these three maps, you can see the effect of relatively wet areas reducing the average diurnal temperature range (the Southeast, mid-Atlantic, Great Basin), while relatively dry areas have a larger implied range. For example, look at dry central Indiana (less moisture for evaporative cooling=hot days) and dry northern Maine (less moisture to trap nighttime heat=cool nights).

Mouse over tabs to change maps.
By the way, thanks for coming back after the mention of “greenhouse gas.” A lot of people ask, if water vapor is such a potent greenhouse gas, why do we not consider it as a driver of long-term warming?
That’s a great question. Here’s the answer: water vapor lasts just hours to days in the lower atmosphere, where its concentrations are high. It’s short-lived and varies from place to place, changes phase into liquid or ice and falls (literally, “precipitates”) out of the atmosphere, when humid air masses are lifted and cooled, which happens constantly. You experience this yourself. When you are in a plume of water vapor, you call it “humid.” When you experience it as precipitation, you call it “rain” or “snow.”
Greenhouse gases like carbon dioxide and methane live long enough that they are well-mixed throughout the lower atmosphere. They have much longer residence times, from several decades to several centuries for methane and carbon dioxide, respectively, because they are chemically fairly stable (they don’t quickly react with other substances), and the temperatures on Earth never get cold enough for these gases to precipitate.
So compared to water vapor, these gases…
Hey WAIT! DON’T GO! Come back!
Rats.
Thanks for going Beyond the Data.
Comments
Add new comment