Wiggle room: why the line tracking sea ice extent is so wavy near the annual winter maximum
On March 22, 2017, the National Snow and Ice Data Center released sea ice statistics for the Arctic and Antarctic. A close look at the extent lines at opposite ends of the globe showed that the line for the Arctic, where sea ice reached its winter maximum, was wavier.
In both hemispheres, polar sea ice extent is more variable around the time of the winter maximum than it is during other seasons. Around the times of their winter maximums, sea ice in both the Arctic and Antarctic experiences lots of small advances and retreats because of storm activity along the ice edge.
Measuring the polar sea ice extent
The National Snow and Ice Data Center (NSIDC) at the University of Colorado-Boulder tracks sea ice using satellite observations, and then graphs each year's minimum and maximum. In both hemispheres, sea ice grows throughout the autumn and winter, and melts throughout the spring and summer. Because the Northern and Southern Hemispheres experience opposite seasons, Arctic sea ice reaches its maximum around March, and Antarctic sea ice reaches its maximum around September. Although each year's sea ice numbers are different, they all follow the same undulating curve.
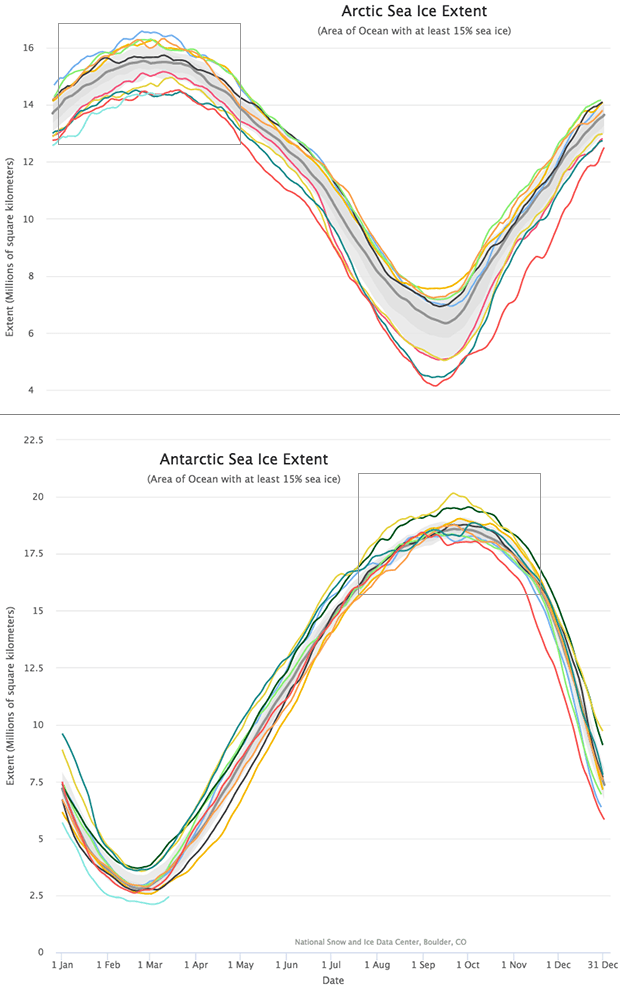
The annual cycle of sea ice extent for the Arctic (top) and Antarctic (bottom) for the years from 1979–1983 and 2013–2017. Near the time of each hemisphere's winter maximum, the rate of change slows (the slope of the lines levels out) and the lines becomes wavy as the ice pack expands and contracts based on storm activity along the perimeter. Graphs taken from the National Snow and Ice Data Center's Charctic visualization tool.
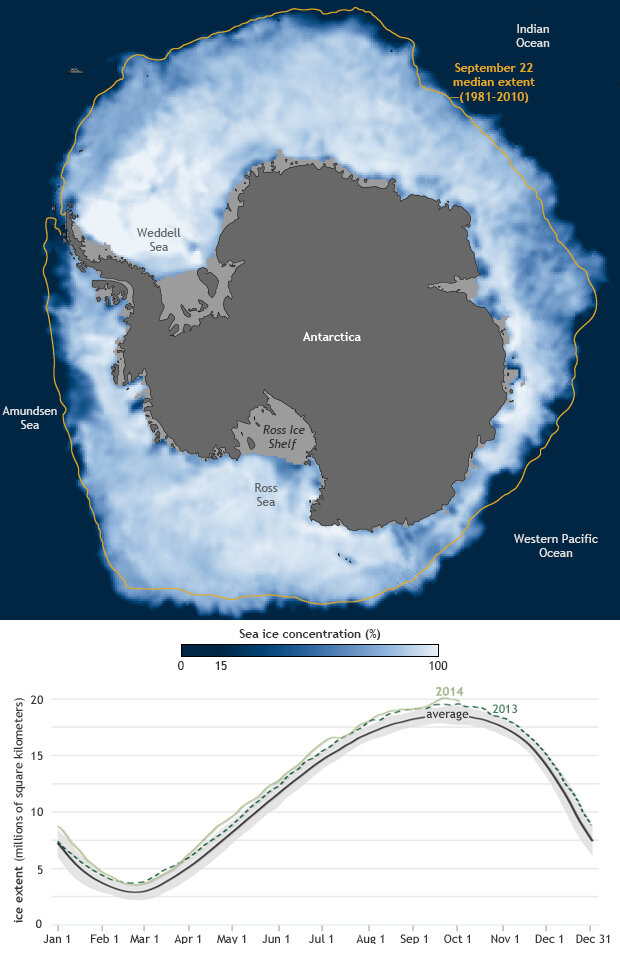
The lines on the graphs show sea ice “extent.” Every pixel of a satellite image where sea ice concentration equals or exceeds 15% is considered ice-covered, and added to the total ice extent. Most ice inside the perimeter of the sea ice pack easily meets the 15% threshold, and it's usually just along the ice edge that the concentration drops below it.
The longest edge
Storms can move sea ice around, and even break up the ice pack in some places, and they have their strongest impact along the sea ice perimeter. Storms can have this effect on the ice edge at any time of the year, of course, but when sea ice reaches its maximum—whether in the Northern or Southern Hemisphere—it has not only its greatest extent but also its longest perimeter. The longer the perimeter, the greater the amount of sea ice exposed potential storm-driven changes.
In addition, during autumn freeze-up, sea ice grows rapidly; during spring melt, sea ice retreats rapidly. Around the time of the winter maximum, though, there isn't such a strong trend. The absence of a strong trend, combined with the extensive perimeter, makes for multiple advances and retreats that show up in sea ice extent. For that reason, the sea ice extent line gets pretty wavy before it starts its yearly downward descent.