What does 2017 look like in your neck of the woods?
Recently, the National Centers for Environmental Information (NCEI) identified February 2017 as the second-warmest February on record for the contiguous United States (CONUS). According to NCEI’s report, the CONUS average temperature for the month of February was 41.2°F. Compared to the twentieth-century average (1901-2000), the CONUS was 7.3°F warmer than average, indicating February 2017 was an abnormally warm month.
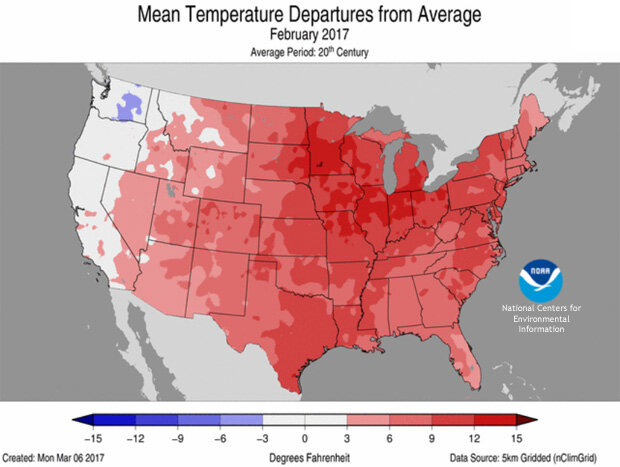
Temperatures across the contiguous United States in February 2017 compared to the twentieth-century average. NOAA NCEI map.
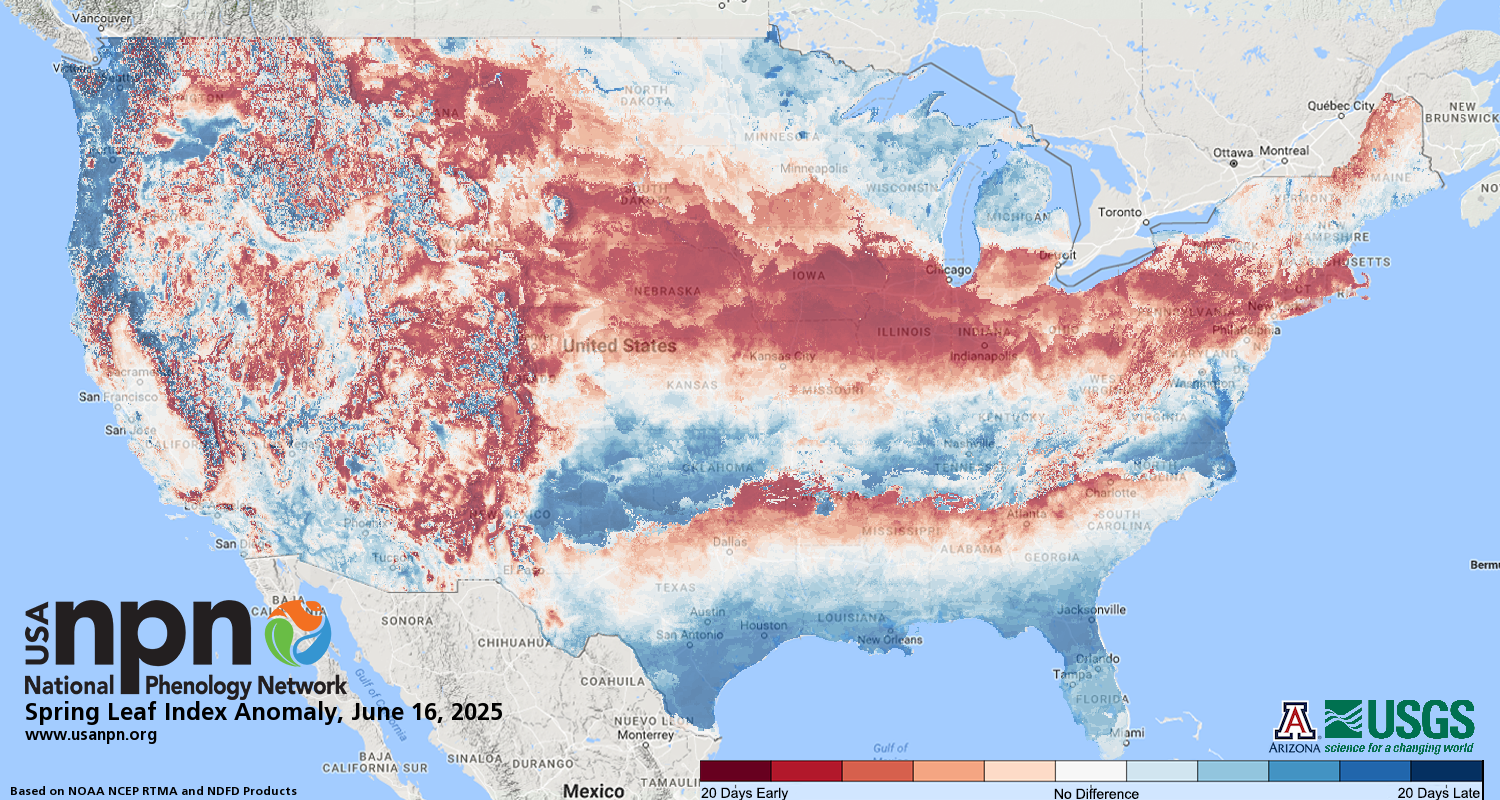
The same can be said for January 2017, with a CONUS average temperature of 33.6°F, which is 3.5°F above average. The warmer than average temperatures so far this year have already led to an early blooming period in the southern and eastern parts of the United States.
The early part of the year has also been relatively wet (or snowy, depending on the location). January and February precipitation averaged across the CONUS were 3.18” and 2.21”, respectively, which is 0.87” and 0.08” above average. January was considered the ninth-wettest January on record, while February’s value was fairly typical for the month, ranking just above the median (middle) value.
Local temperatures to date
While national reports provide useful information, most people really want to know what the weather was like in their own area, usually from a nearby weather station. Luckily enough, the data used to compile the national reports originate from weather stations in the Global Historical Climatology Network - Daily (GHCN-D) dataset. Every day, stations around the world report information such as temperature, precipitation, and snowfall. These values are then sent to NCEI for processing, quality control, and archiving for public dissemination. More than 15,000 of these stations are located in the United States, and we can use that data to understand what 2017 looks like so far on the local scale.
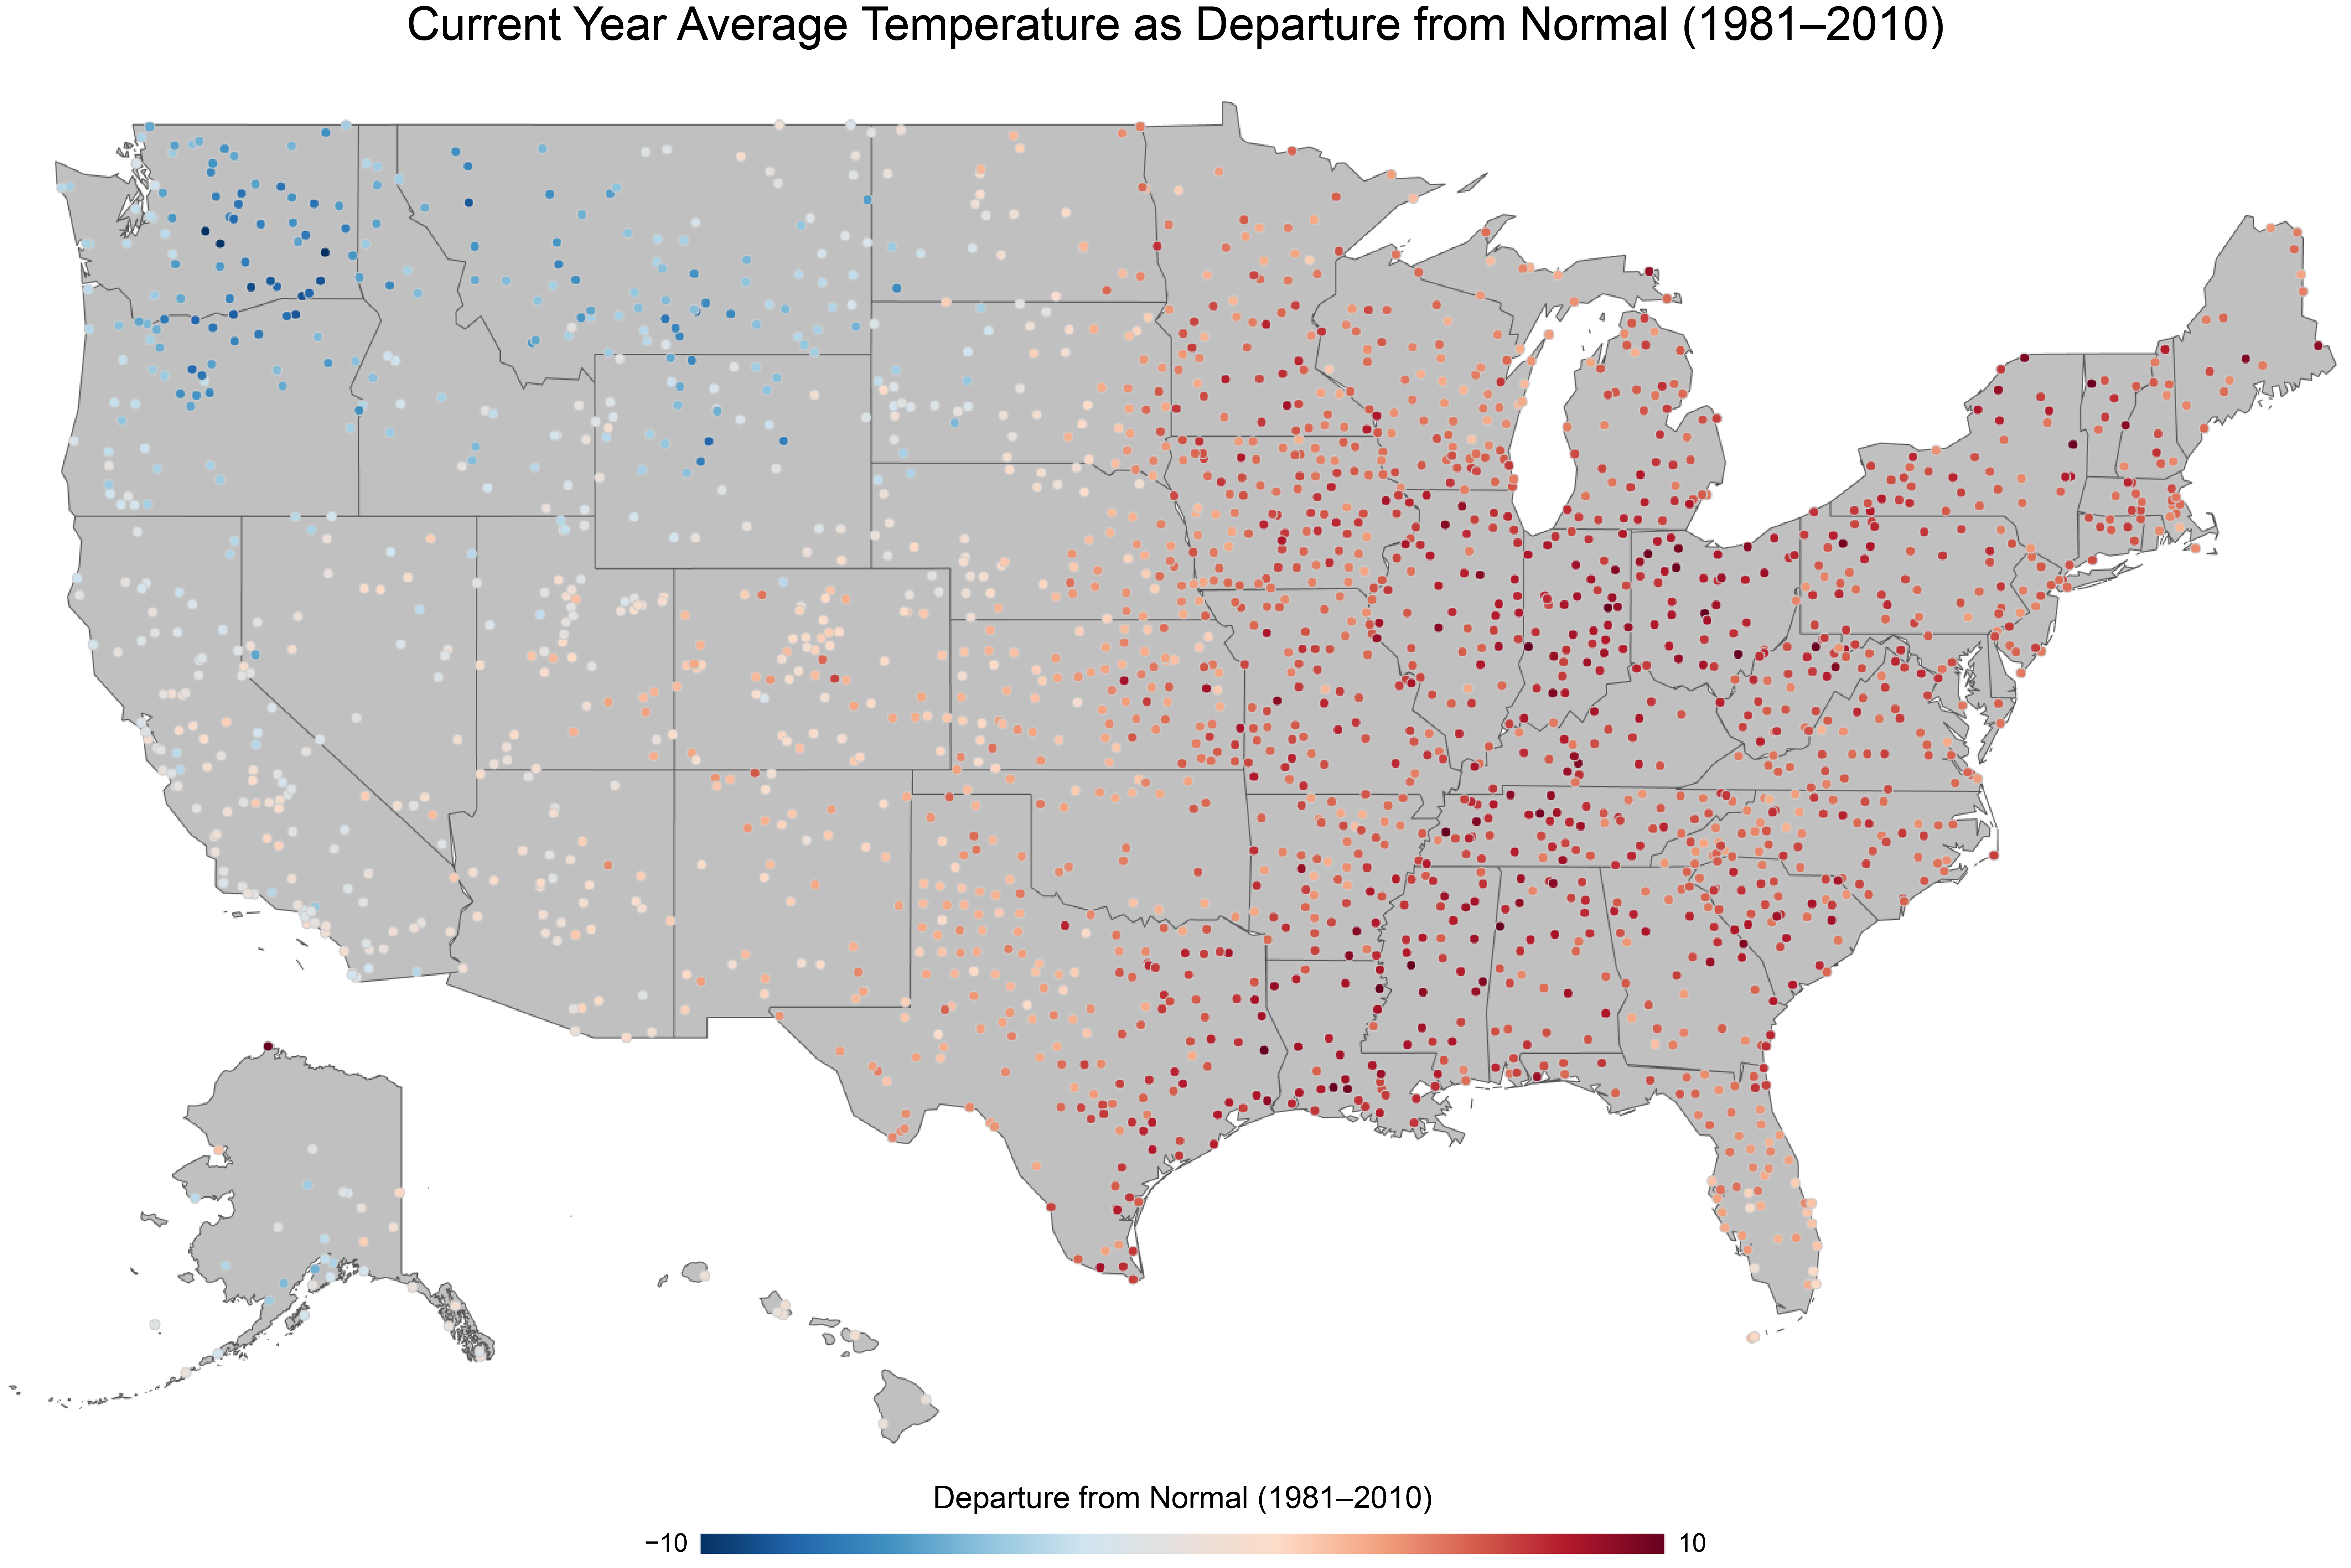
Sometimes people want to see the actual data for a location: a massive table of days, times, and raw numbers. Users who want raw data can order it directly from NCEI. Many users, though, want to see maps and other graphics based on the climate data at their location. For those folks, scientists at the Cooperative Institute for Climate and Satellites - North Carolina, located at NOAA’s NCEI, have done a year-to-date analysis that provides an interactive display of temperatures for individual weather stations using the daily Global Historical Climatology Network observations. Values are color-coded by their difference from the 1981–2010 mean. Only stations with 50 or more years of complete data are used in this analysis, and any data flagged by quality control were not included.

Average temperature for 2017 to date compared to the 1981-2010 average. Red colors indicate warmer than average, and blue colors cooler. Data originates from GHCN-Daily, and only stations with at least 50 years of complete data are used. Clicking on the map will launch the interactive map. A larger version of the static map is here.
The map above shows the average temperature for 2017 (year to date, through early March) for all the stations that met our criteria. The vast majority of stations in the eastern half of the United States are in shades of red, indicating locations that were warmer than average for the year to date. The darkest shades of red indicate temperatures ranging from five to seven degrees or more above average. Those of you in Alaska have also seen a geographic split: southern parts of the state have seen slightly cooler than normal temperatures, but Barrow, in the north, has been much warmer than average—more than 10°F above normal! Parts of the northwestern United States, especially the states of Washington and Oregon, have seen cooler-than-average conditions so far in 2017, indicated by shades of blue.
From the national map, you can click on any station to see a graph of the daily temperatures for 2017 at that location. We did that for a station located at Delaware County Airport in Muncie, Indiana, about 60 miles northeast of Indianapolis. The image below shows the result.
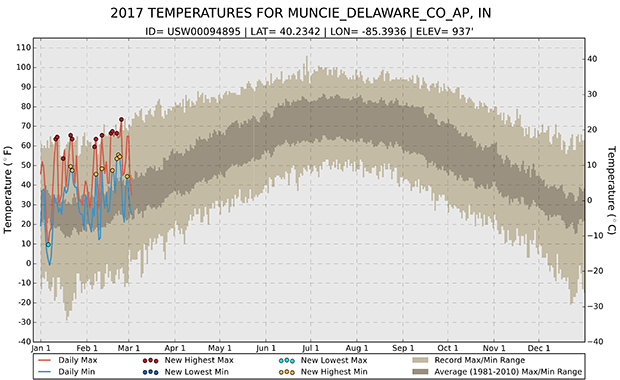
2017 daily maximum and minimum temperatures for Delaware County Airport, Muncie, Indiana. Values compared against the 1981–2010 average, as well as their absolute maximum and minimum. Dots indicate new records set in 2017 for a particular day.
Using only the reported daily maximum and minimum temperature, a lot can be said about this station. For starters, this station, reporting since 1962, has seen some of its warmest temperatures on record. The 2017 observations for the station are plotted against its 1981–2010 mean, along with the record value for each day. Each red dot is a day on which the 2017 value set a new record maximum (daytime high). Each yellow dot is a day with a new warmest minimum (overnight low).
This station actually started the year off cold, even breaking one of its lowest maximum temperature days on record (blue dot) with a high temperature of just 9°F on January 6. However, things began to heat up, breaking 12 maximum temperature records so far this year. Also of note is that there were 9 times in the year where the overnight minimum temperature was its warmest on record, which is consistent with a general trend of increasing minimum temperatures.
So far, the 2017 average temperature for this station is 38.6°F. While that does not sound high, comparing it to the 1981–2010 normal (which is below freezing at 27.8°F) indicates this station has been nearly 11 degrees warmer than normal so far this year.
Local precipitation to date
We can do a similar analysis for year-to-date precipitation, which is shown in the map below. Here, station values are reported as percent of normal. Values over 100% mean wetter than the 1981–2010 average, and values under 100% were drier.
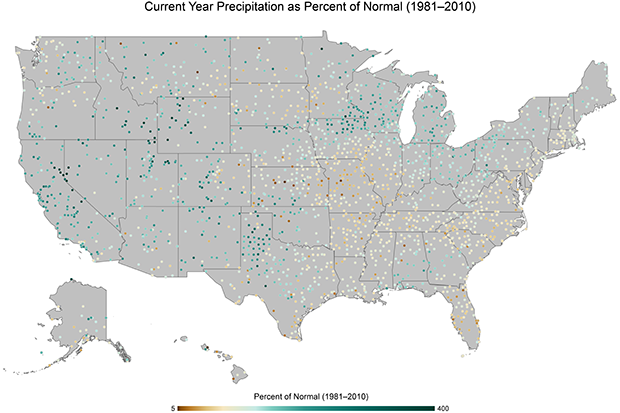
2017 accumulated precipitation as percent of normal (1981-2010). Green colors indicate wetter than average, and brown colors indicate drier. Data originates from GHCN-Daily, using only stations with at least 50 years of complete data.
Parts of the U.S. Midwest and Southeast have been drier than normal, while parts of the western US, especially California and Nevada, have been (finally!) wetter than normal. Many stations around the Great Lakes from Wisconsin eastward to New York have received more precipitation than normal), while coastal locations of New England were slightly drier than normal.
Similar to the temperature analysis, we can investigate rain and snow at individual stations. Here, instead of showing precipitation values for each day, each pale blue line represents a different year. Daily precipitation amounts are added up throughout the year, so each year’s total accumulation can be compared to other years. Brightly colored lines show the wettest, driest, and average years for comparison. These graphs can be interpreted as a “race through time” to see where the overall accumulation will be at the end of the year.
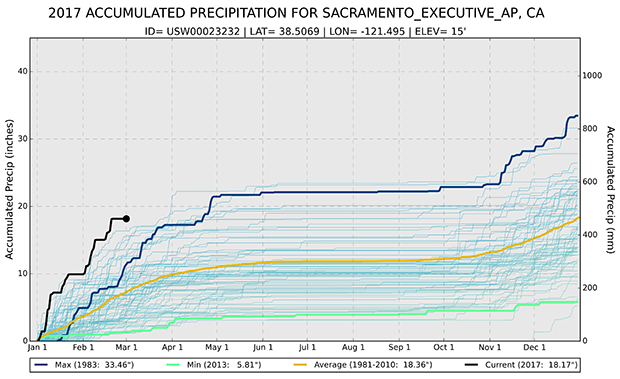
Accumulated precipitation for Sacramento, CA. Black line indicates accumulation for 2017, compared to the 1981-2010 mean (yellow), wettest year (blue), and driest year (green).
The graph above shows the accumulated precipitation for Sacramento, CA, which has been reporting since 1941. According to the United States Drought Monitor, in under a year’s time, Sacramento transitioned from one of its most extreme droughts ever to having no drought at all. Running through 2017 so far, Sacramento has seen higher than average precipitation starting from day one. Numerous multiday rain events in both January and February have caused a large spike of accumulation (the black line).
In another part of the country, Sacramento’s 18 inches of rain so far in 2017 might seem small, but the city typically sees drier conditions, with less than about 9 inches of accumulated rainfall on average by the time March rolls around. This means that the city has seen over 200% of its normal precipitation so far. While we are only through two months of 2017, this station is already more than halfway towards breaking the annual precipitation record of 33.46 inches set in 1983.
Using a few simple statistical routines, weather stations across the United States can tell your climate story. We hope these visualizations help you better understand the data and answer your questions of how warm, cold, wet, or dry it really has been in your area. If you wish to see what the data looked like for 2016 (2nd warmest and 24th wettest year on record for CONUS), you can find that information here for temperature and here for precipitation.
Comments
Gratitude.
Add new comment