February 2017 ENSO update: bye-bye, La Niña!
Well, that was quick! The ocean surface in the tropical Pacific is close to average for this time of year, putting an end to La Niña, and forecasters expect that it will hover around average for a few months. Let’s dig in to what happened during January, and what the forecast looks like.
Not with a bang
This La Niña wasn’t exactly one for the record books. Our primary index, the three-month-average sea surface temperatures in the central Pacific Niño3.4 region, only dipped to about 0.8°C cooler than the long-term average during the fall of 2016. However, these cooler-than-average temperatures persisted for several months, and the atmosphere over the tropical Pacific responded as expected to the cooler waters. Namely, during the fall and winter to date, the Walker Circulation was strengthened: stronger near-surface east-to-west trade winds, stronger upper-level west-to-east winds, more rain than usual over Indonesia, and less rain over the central Pacific.
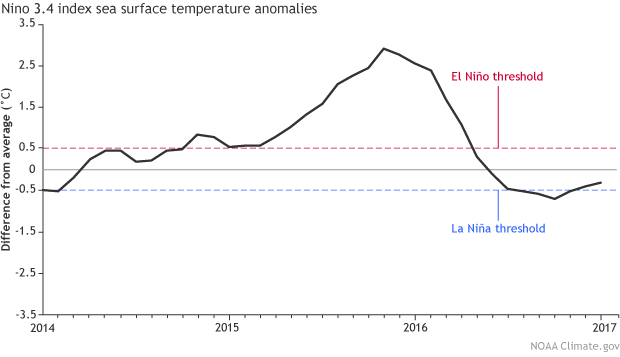
Monthly sea surface temperature in the central tropical Pacific Niño 3.4 region, from OISST.v2 temperature data. Data shown is the difference from the 1981-2010 average. Climate.gov graph from CPC data.
During January, the sea surface temperature edged close to normal, and the average temperature in the Niño3.4 region was just about 0.3°C below normal by the end of the month. (Note, this is using the weekly OISST data. There are some differences between our sea surface temperature data sets, which Tom described in detail here.)
Another factor that we watch is the temperature of the tropical Pacific Ocean below the surface. Over the past few months, the amount of cooler-than-average water at depth has been decreasing, and by the end of January it had disappeared. These deeper waters often give an idea of what we can expect at the surface in following months. Meaning, the lack of cooler water at depth makes it unlikely that the surface will cool off again substantially in the next few months.
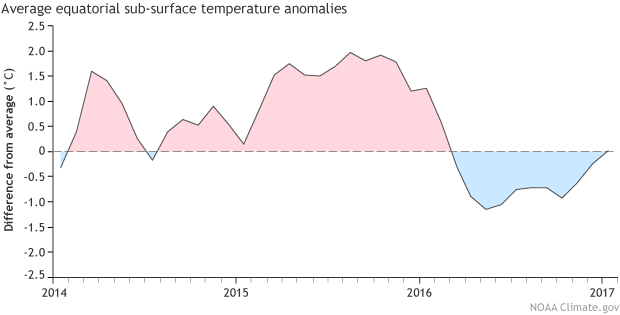
Monthly average heat content in the upper 300m of the equatorial Pacific. Data shown is the difference from the 1981-2010 average between 180°W and 100°W. Climate.gov graphic from CPC data.
There was also some evidence of a lingering La Niña effect on the Walker Circulation during January, with more rain and cloudiness over Indonesia and less over the central Pacific. Also, the trade winds along the equator in the western Pacific were slightly stronger than average in January, but the upper-level winds were about average.
Overall, the atmosphere/ocean system is demonstrating that it’s returned to ENSO-neutral conditions, putting an end to the not-so-great La Niña of 2016/17.
What’s in store for 2017?
Most computer models agree that neutral sea surface temperatures will continue for the next few months, and forecasters estimate an approximately 60% chance of neutral conditions lasting through the spring. After that, it gets a bit more complicated. Some of the computer models are calling for a return of El Niño conditions by the second half of 2017.
These models have a pretty good track record, so we’re not completely ignoring them. However… Remember the so-called spring predictability barrier? Here’s a brief recap of Michelle’s great post: computer models (and human forecasters) have a very hard time predicting the future when the March–May period is in the way. In fact, a forecast made in June for the sea surface temperature in December (six months away) can be more successful than a forecast made in February for May (three months away)!
One of the reasons models have a hard time looking past the spring is that spring is often a transitional time, when ENSO events wind down and neutral conditions prevail. It can be tougher to predict the change into a new phase than to predict the growth, continuation, or demise of an event.
The bottom line is that we’re giving the odds of developing El Niño conditions a slight edge for fall 2017, with the probability around 50%. The baseline chance of El Niño, La Niña, or neutral conditions occurring in the fall of any random year are about 33% each. Our current consensus forecast for the September—November 2017 period estimates a 12% chance of La Niña conditions, 40% chance of neutral conditions, and a 48% chance of El Niño.
Meanwhile, in the far eastern Pacific…
Sea surface temps in the central Pacific may have returned to near-average, but the surface waters near the coast of Peru are quite a bit warmer than average.
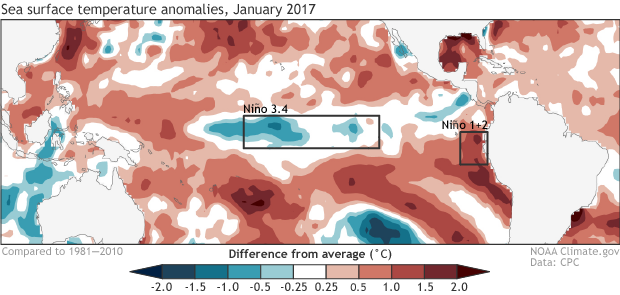
Average sea surface temperature during January 2017, shown as departure from the long-term (1981-2010) average. Climate.gov figure from CPC data.
The sea surface temperature in the Nino1+2 region has been trending upward for the past few months, and recently jumped to around 1.2°C above average during January.
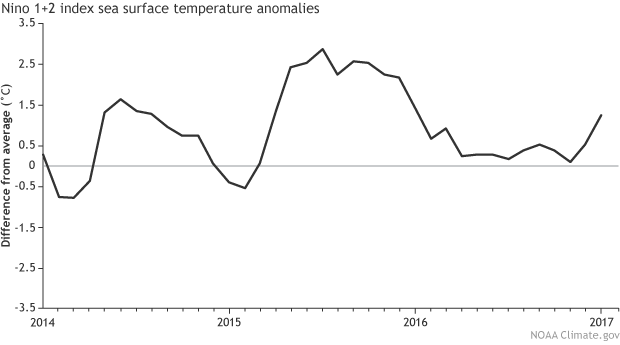
Monthly sea surface temperature in the eastern tropical Pacific Nino1+2 region, from OISST.v2 temperature data. Data shown is the difference from the 1981-2010 average. Climate.gov graph from CPC data.
Our colleague Ken Takahashi of the Instituto Geofisico del Peru says that their country is officially in a “coastal El Niño” based on the anomaly in the Niño1.2 region. Note, this is very different from our definition of El Niño! Peru has experienced heavy rains and flooding over the past few weeks, which is expected when the Niño1+2 region warms substantially. Peru is affected both directly by the warm water on their coast, and indirectly by atmospheric circulation changes caused by sea surface temperatures in the central Pacific, whereas ENSO affects the U.S. only by the indirect “teleconnections.”
Heading into the spring and summer, we’ll keep a close eye on the ENSO forecast, and on various ENSO-related happenings around the world. Watch this space!
Comments
Nino 1+2 index sea surface temperature anomalies
RE: Nino 1+2 index sea surface temperature anomalies
I am not so sure that La Nina anomalies will increase over time. I also don't know if you mean the SST anomalies of La Nina, or the weather patterns associated with La Nina. As far as what we can expect regarding predictable La Nina weather patterns, nothing will change quickly, on average, even as the climate may slowly change (mainly global warming). It is inconclusive whether ENSO behavior, in terms of SST patterns, will change as the overall climate slowly changes. There are projected changes in the average temperature and precipitation for the next 50 years, according to the climate change models, and one might suppose that those might be additional to the "normal" patterns associated with today's La Nina events. Or, the climate change patterns might interact with the ENSO patterns in a more complicated way, where we could not just add one to the other. All of these possible long-term outcomes are not clear currently, because different models handle it in different ways. But I think it's fairly safe to assume, for now, that in the near future (the next, say, 15-20 years) the temperature and rainfall patterns associated with La Nina will remain approximately the same as they are currently, based on historical data and our current climate models (not the climate change models). Even without cllimate change, the average climate effects of La Nina (or El Nino) are not expected to appear the same way in every La Nina, and in some regions the expected effects sometimes may not occur at all.
RE: Nino 1+2 index sea surface temperature anomalies
RE: RE: Nino 1+2 index sea surface temperature anomalies
Hi-- I can assure you that our forecasts are better than random guessing or equal chances. Check out Tom's post here and related ones. Just because one region of the country did not verify in the favored forecast category, does not mean the entire forecast was useless everywhere. Plus, as noted in several places on the blog, we do not provide 100% guarantees. We issue probabilistic predictions which assign a percent chance of a certain outcome. In climate prediction, we know the uncertainty is larger so we explicitly factor that into the forecasts. I could understand your frustration if we said "California is going to be entirely dry because of La Nina" but that was not our forecast.
Given the fact that the short
RE: Given the fact that the short
Yes, 1964-65 showed a weak La Nino, indeed. And the El Nino in 1965-66 was a fairly strong one. I don't know what the NAO was doing in 1965, though. What I do know is that the PDO (Pacific Decadal Oscillation) was mainly negative during the middle 1960s, while it has been positive for at least the last 2 years. That may further encourage El Nino development later this year, along with the residual positive SST anomalies from the strong 2015-16 El Nino just outside of the tropics in the Pacific. But analogs are known not to work very well, due to the lack of excellent analogs in the relatively short historical record. So we will need to wait and see what develops, and the "spring barrier" creates considerable uncertainty right now.
1902-1904 analog with 1964-1966
Strong warming at the moment
Strong El Niño again?
RE: Strong El Niño again?
It's still very early to confidently predict that El Nino will return later this year. While some forecast models, including all of the models in the North American Multi-Model Ensemble (NMME), many other models do not redevelop El Nino nor do a fair number of statistical techniques. At this point, the official forecast provides about a 50% chance of El Nino developing later this year, but that also means there's a 50% chance it won't develop.
Correlation fallacies
REPETICIÓN DEL NIÑO
RE: REPETICIÓN DEL NIÑO
50%
Hope
Good Riddance, La Nina!
Add new comment