August 2016 ENSO update: Wavy gravy
It’s August already, El Niño is long gone, and we’re still stuck in neutral. Is La Niña on the way? And is anything interesting going on in the tropical Pacific?
Currently, forecasters think there’s a slightly better than 50% chance of La Niña developing in August–October and then a 55-60% chance during the winter. Right now, it looks like if La Niña does manage to form and last the five consecutive, overlapping seasons necessary to qualify as an ENSO event, it’s likely to be a weak one.
Let’s start by checking in with current conditions. During July, sea surface temperature in the Nino3.4 region of the tropical Pacific was -0.21°C (-0.38°F) below average, according to ERSSTv4, the dataset we use for all our forecast verification. You may have also seen the monthly value for July from the OISST dataset, which was -0.49°C below average. Which one’s right?
Check out Tom’s post for details, but in short, these two datasets have different geographic detail: ERSSTv4 is lower resolution, while OISST has a finer grid with more spatial detail. Since the current area of colder-than-average water is a narrow strip along the Equator, the average over the Niño3.4 region can be different depending on the dataset.
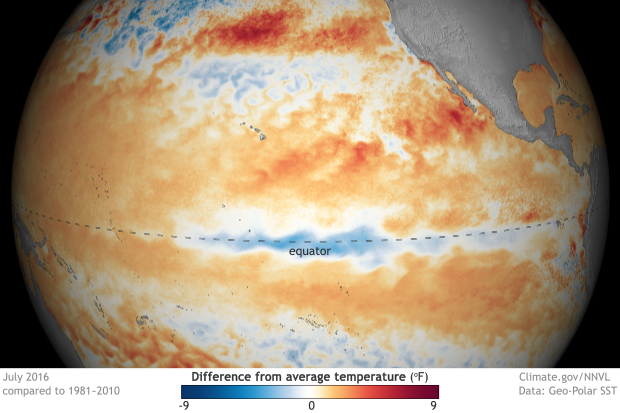
Sea surface temperature in July 2016 compared to the 1981-2010 average. Cooler-than-average waters are present in the central tropical Pacific. NOAA Climate.gov map, based on GEO-Polar data.
I realize I haven’t answered the question “which one is right?” That’s because they both are–they’re just different. We use the ERSSTv4 for all our long-term monitoring, because it has been carefully quality-controlled and extends back to 1950. OISST is used as the starting point for a lot of climate models, because it has daily data available, and has that higher resolution. The finer detail in the OISST also allows it to pick up on smaller-scale changes like the current cool Niño3.4 index.
Situation Neutral
July’s tropical atmosphere mostly looked like neutral conditions, too, with nearly average winds across the tropical Pacific region. There have been some hints of more rain than average over Indonesia, and less over the central Pacific, as well as a slightly positive trend in the Southern Oscillation Index and Equatorial Southern Oscillation Index. These might be early hints of a La Niña pattern… or might just be short-term changes. So we’re playing a waiting game right now.
Like we did with El Niño, we have to see a certain set of conditions before we can declare the onset of La Niña. First, the monthly Niño3.4 index needs to drop to or below -0.5°C. It’s close, but not there yet. After that, we need to see forecasts that it will stay below that threshold for five overlapping three-month periods (“seasons”). Finally, we need to see the right response from the atmosphere: a strengthened Walker circulation, meaning stronger surface easterly and upper-level westerly winds over the equatorial Pacific Ocean, lower-than-average pressure and more rainfall over Indonesia, less rainfall over the central Pacific, and higher-than-average pressure in the vicinity of the eastern Pacific.
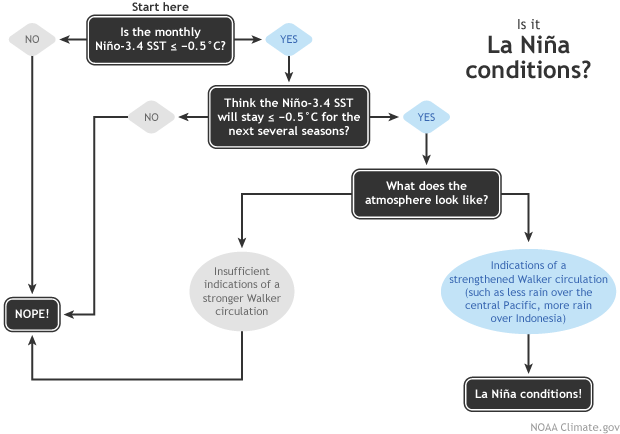
Flowchart showing decision process for determining La Niña conditions. Figure by Fiona Martin, adapted by Climate.gov.
What did one ocean say to the other? Nothing, it just waved.
If you look at the map of one-week average sea surface temperature, you may have noticed an interesting feature along the eastern and central equatorial Pacific: a series of waves along the edge of the “cold tongue”. The cold tongue (that term always gives me the heebie-jeebies) is a narrow strip of cooler water right along the Equator that’s present during neutral and La Niña conditions, and is strongest between July and November. It comes from deep ocean water that rises up near the South American coast, and is then spread westward by surface currents. El Niño’s warming reduces the cold tongue.
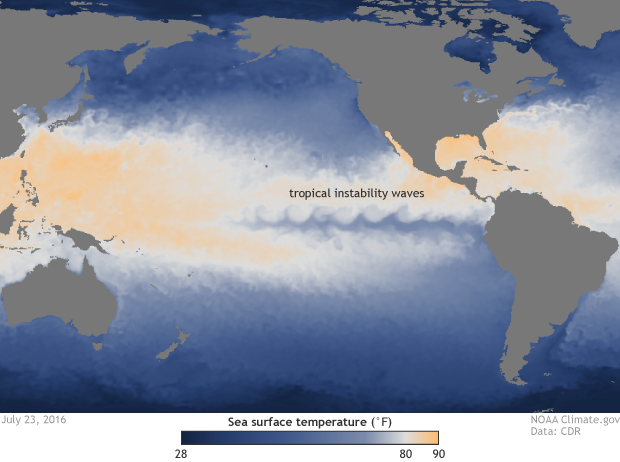
Sea surface temperature on July 23, 2016. The eastern Pacific cold tongue is clearly visible along the Equator, surrounded by warmer waters to the north and south. The wavy features along the northern and southern borders between the cold tongue and the warmer waters are tropical instability waves. The waves on the north side are clearer in part due to the stronger temperature gradient on that side of the cold tongue. Map by NOAA Climate.gov from CDR data.
The waves near the cold tongue are called tropical instability waves, and they were first noticed in 1977, at the beginning of the satellite era (1). They’re occasionally called Legeckis waves, after the scientist who first observed them. They emerge and move west over a few weeks, so they tend to get washed out in a monthly or seasonal average temperature anomaly map.
Tropical instability waves are partly a result of the difference in temperature between the cold tongue and the waters just north and south of the Equator. The interface between the colder and warmer water is called a front, just like the cold and warm fronts we see in the atmosphere. Whenever you have sharp differences in temperature, nature wants to mix it up to even things out, creating the conditions for waves to form. During La Niña, the cold tongue is cooler than average, and the fronts are intensified, usually leading to stronger tropical instability waves.
Tropical instability waves aren’t just an end result, though: they mix warmer water in to the cold tongue and interact with the atmosphere, affecting winds and surface pressure. ENSO influences the development of the waves (by affecting the north-south temperature gradient between the cold tongue and the off-equatorial water), and the waves and their atmospheric interaction can influence the characteristics of ENSO. Some researchers have found that, since tropical instability waves are prominent during La Niña, the effect of mixing the warmer waters in to the cold tongue can reduce the amplitude of La Niña (2).
A lot of research has been done to understand these waves and their interaction with ENSO, and there is some evidence that including them in the observations used as starting points for climate models can result in improved forecasts (3, 4). However, they’re just one feature of an immensely complicated system. For now, we’re back in borderline territory, and still in a La Niña Watch. We’ll continue keeping a close eye on both the tropical Pacific and computer model forecasts, and keep you posted on changes.
Many thanks to my colleagues Caihong Wen (Climate Prediction Center) and Jim Carton (University of Maryland, College Park) for their assistance with this post.
References
(1) Willett, C.S., R.R. Leben, and M.F. Lavin, 2006: Eddies and Tropical Instability Waves in the eastern tropical Pacific: A review, Progr. Oceanogr., 69, 218-238.
(2) Im, S.-H., S.-I. An, S. T. Kim, and F.-F. Jin (2015), Feedback processes responsible for El Niño-La Niña amplitude asymmetry, Geophys. Res. Lett., 42, 5556–5563, doi:10.1002/2015GL064853.
(3) Caihong Wen, Yan Xue, and Arun Kumar, 2012: Ocean–Atmosphere Characteristics of Tropical Instability Waves Simulated in the NCEP Climate Forecast System Reanalysis. J. Climate 25, 6409–6425, doi: 10.1175/JCLI-D-11-00477.1.
(4) Ham, Y. & Kang, I., 2011: Improvement of seasonal forecasts with inclusion of tropical instability waves on initial conditions. Clim Dyn 36: 1277. doi:10.1007/s00382-010-0743-0
Comments
El Nino Graph
blog
Equatorial Upwelling contributes/maintains "cold tongue" too
Add new comment