When rivers reach the sky
Guest co-author Dr. Kai-Chih Tseng is a postdoctoral research scientist at Princeton University and the NOAA Geophysical Fluid Dynamics Laboratory who is an expert on climate variability and prediction, including the study of atmospheric rivers. In the summer of 2022, Dr. Tseng will begin an assistant professor position in the Department of Atmospheric Science at National Taiwan University.
This past December, a mind-boggling 18 feet of snowfall fell in the California Sierra Nevada Mountains! How does so much snow fall in one place in such a short period of time? One of the primary phenomena responsible for such extreme rain and snowfall, particularly in regions like the western U.S., is the atmospheric river. Like their terrestrial counterparts, atmospheric rivers carry tremendous amounts of water over thousands of miles. These aerial versions, however, often bring both severe disruption and great benefit through the heavy rain and mountain snows that they produce. In this blog post, we will give you a brief primer on atmospheric rivers and (of course!) explain how they are affected by ENSO (El Niño-Southern Oscillation).
Flying Mississippis
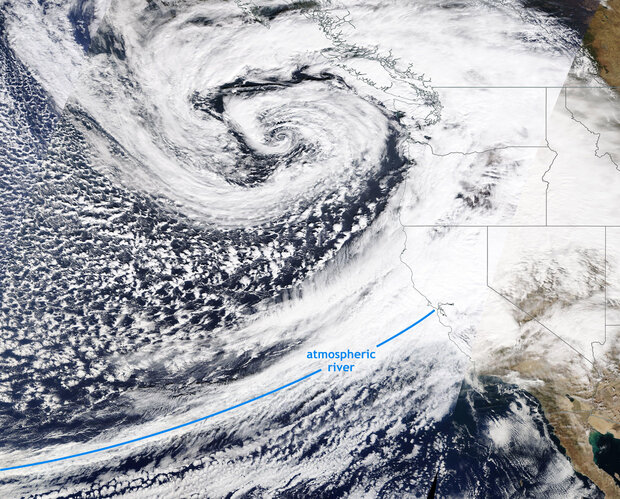
Satellite image taken on October 24, 2021. A powerful storm off the Pacific Northwest coast brought an intense atmospheric river to the San Francisco Bay region of California. NASA MODIS/TERRA satellite image taken from NASA Worldview.
Atmospheric rivers are long, narrow corridors of moisture-laden air extending from the tropics to higher latitudes. They can produce heavy rain and snowfall in short periods of time, especially when the air is lifted over high terrain, cooling the air and condensing the moisture into droplets, like wringing out an atmospheric sponge. When you see these impressively long features on satellite imagery, it’s no wonder that they are compared to rivers. In fact, an average atmospheric river carries 25 times the amount of water as the Mississippi River!
They form when warm, moist air in lower latitudes is transported poleward like a conveyor belt ahead of a trailing cold front from a powerful mid-latitude storm. Around the globe, atmospheric rivers are responsible for more than 90% of the water vapor that is transported to the mid-latitudes from the tropics and are a critical source of water for many regions, such as California and Nevada. They also can be quite destructive, causing severe flooding and damaging winds, with the strongest atmospheric rivers in the western U.S. typically causing damages in the hundreds of millions of dollars (1).
Total precipitable water (the depth of water in a column of the atmosphere, if all the water in that column falls as rain) from October 23-25, 2021, showing the atmospheric river that battered the San Francisco, California region. Animation generated with MIMIC-TPW data and the Jupyter notebook provided by the Seasoned Chaos Blog.
Several notable atmospheric rivers have made landfall along the West Coast of the U.S. this past fall and winter. On October 24-25, 2021, an intense atmospheric river brought high winds and historic rain reaching up to a foot to the San Francisco Bay region, providing a temporary reprieve from an enduring drought (but clearly not enough to end it). The animation above (2) shows the narrow, river-like corridor of concentrated water vapor that resulted in this historic rainfall. California is no stranger to this “boom or bust” precipitation pattern. Incredibly, up to half of the annual precipitation in parts of California falls in just 5 to 10 wet days during the year (is it any wonder that seasonal prediction of precipitation is so hard?), and atmospheric rivers are a major source of those few wet days (3). California is unique in terms of such extreme precipitation variability, but other western states, like Washington and Oregon, also rely on atmospheric rivers for water supply.
So, where and how often?
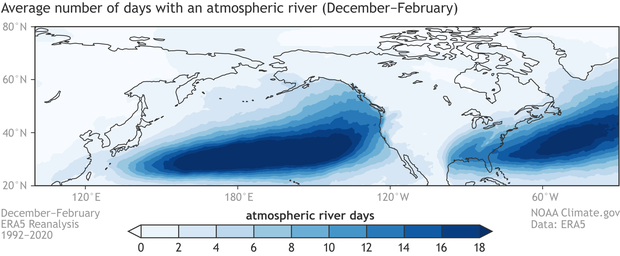
Average number of days each winter (December–February) with an atmospheric river occurrence over the northeastern Pacific Ocean. Maps calculated with ERA5 Reanalysis data covering the 1992-2020 period and with the Mundhenk et al. (2016) method for detecting atmospheric rivers.
Atmospheric rivers (see footnote 4 for how we define them) occur throughout much of the globe outside of the tropics and in all seasons, but they are most frequent in the storm tracks in the vicinity of jet streams. Their impacts on the U.S. are most pronounced in winter. The figure above shows that in a typical December–February period, atmospheric rivers near North America occur most often offshore in the North Pacific and North Atlantic. Although their importance is emphasized in the western U.S. because of their large contribution to annual rain and snow totals, they also frequently occur in central and eastern U.S. states, where we can expect approximately 10 winter days each year with an atmospheric river occurrence.
This is the ENSO Blog!
Don’t worry, we didn’t forget about the role of ENSO! Just as ENSO impacts the seasonal temperature and precipitation patterns over North America, it also affects the frequency of landfalling atmospheric rivers. Over the past 30 years, El Niño has brought more frequent than normal West Coast landfalling atmospheric rivers, whereas La Niña generally has brought less frequent occurrences. This winter has been pretty consistent with typical La Niña conditions, with below-average western U.S. atmospheric river activity. Despite a two-week period in December that brought atmospheric rivers and record snow to California, January was the second driest on record in California and Nevada.
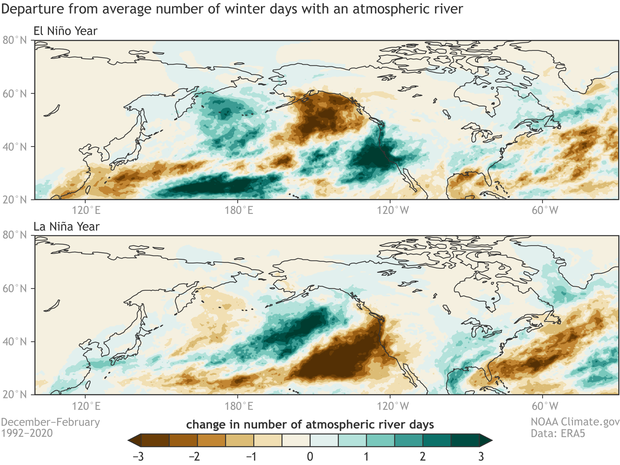
Departures from the average number of days each winter (December–February) with an atmospheric river occurrence for (top) El Niño and (bottom) La Niña from 1992-2020. During El Niño winters, the number of days with atmospheric rivers is below average along the Alaska and western Canada coastlines, but above average along the U.S. West Coast. La Niña tends to bring the opposite: fewer atmospheric river days along the U.S.West Coast.
But how well can we predict atmospheric rivers?
As with all extreme precipitation events, accurate forecasts of individual atmospheric rivers and their impacts are limited to short-range weather forecasts. However, the latest research efforts are advancing our ability to predict regional atmospheric river activity (not individual storms) on subseasonal (roughly 2-4 weeks in advance) and even seasonal time horizons. On subseasonal timescales (5), the sources of atmospheric river predictability are rooted in large-scale climate patterns such as the Madden-Julian Oscillation and the Pacific-North American Pattern. On the seasonal side, a recent study led by guest co-author Dr. Kai-Chih Tseng indicates that one of the models participating in the North American Multi-Model Ensemble (NMME), SPEAR, can produce skillful seasonal forecasts of atmospheric river activity over some regions, including coastal California and Alaska, up to nine months in advance. The guiding hand of ENSO is one of the main reasons that seasonal atmospheric river forecasts may be possible.
Effects of climate change
Human-caused climate change is likely to increase atmospheric river intensity. Warming oceans lead to increasing available moisture for these powerful storms, enhancing the moisture transport and heavy precipitation that they produce. While several global climate model studies support the increasing intensity of atmospheric rivers with global warming, additional study is needed to better understand how other atmospheric river properties, like size, shape, frequency, and location, will change.
The bottom line is that any increase in atmospheric river intensity will contribute to the growing water resource challenges in the western U.S. Therefore, we can expect that improving our understanding and our ability to predict atmospheric rivers across a range of timescales will remain a major scientific priority.
Footnotes
- For more information on how destructive atmospheric rivers can be for the western U.S., we recommend this article. Corringham et al. (2019) use a scale that divides atmospheric rivers into 5 intensity categories, like what we do for hurricanes and tornadoes.
Corringham, T. W., Ralph, F. M., Gershunov, A., Cayan, D. R., & Talbot, C. A. (2019). Atmospheric rivers drive flood damages in the western United States. Science Advances, 5(12), eaax4631. https://doi.org/10.1126/sciadv.aax4631
- Hat tip to our friends at the Seasoned Chaos blog for providing the tools to construct this animation. Please check out their awesome complementary post on atmospheric rivers.
- For additional information on the link between atmospheric rivers and California’s water resources, we recommend this article.
Dettinger, M.D., Ralph, F. M., Das, T., Neiman, P.J., & Cayan, D. R. (2011). Atmospheric rivers, floods and the water resources of California. Water, 3(2), 445–478. https://doi.org/10.3390/w3020445
- At this point, you may be saying, “Wait, Nat and Kai-Chih, how do I know if an atmospheric river is occurring?” Good question! There is no single, objective method to identify atmospheric rivers, but there are several algorithms that are commonly used. All these algorithms share at least two features in common: (1) atmospheric vapor transport must be unusually strong, and (2) the vapor transport must be concentrated in a feature that is long and narrow. In the analysis of this blog post, we analyze daily fields of vertically summed water vapor transport and use the method of Mundhenk et al. (2016) to identify grid cells where an atmospheric river is occurring. The Mundhenk et al. (2016) method ensures that the two criteria listed above are met.
- For example, check out some of the neat experimental subseasonal atmospheric river forecast products provided by the Center for Western Weather and Water Extremes (CW3E) at this site.
Comments
Ríos atmosféricos
Excelente información. Gracias por compartir, la predicción del clima, es un tema de vida para cualquier persona en cualquier lugar del mundo.
Atmospheric Rivers
It seems like the article is not taking into account the seriousness of increased water vapor that is being added to the atmosphere due to the increase in temperature of the oceans. The additional energy added to the oceans increases the evaporation rate of water because the water molecule is an excellent molecule at being able to absorb heat energy. The more heat energy the water molecule absorbs, the longer the water molecule can persist in the form of humidity (water vapor) in the atmosphere, which is why the equatorial countries are always humid.
The laws of physics apply to the weight and presence of the water molecules in the atmosphere.
The increased water particles in the atmosphere results in an increased rate of particle collision.
The increased weight of the water in atmosphere also has an effect on the severity of the winds.
The increased weight of the water increases the potential energy of each raindrop that forms, and when the rain falls, the potential energy changes to kinetic energy.
All of the laws of physics are centered around the mass of the particle.
Yes increasing temperatures…
Yes increasing temperatures lead to more water vapor in the atmosphere but I'm not sure exactly what point you are trying to make regarding atmospheric rivers.
The article does state that "Human-caused climate change is likely to increase atmospheric river intensity. " so that is touched upon.
Animation of AR
Thanks for this very detailed article about AR. Here’s a new visualization by NASA
https://svs.gsfc.nasa.gov/4960
Love it! A wonderful video
Love it! A wonderful video
Florida
How do these changes affect Florida an hurricanes ..see many atmosphere rivers here...we call it the whip..severe storms at bottom of northern storms as advance east
ARs and Florida
Atmospheric rivers are distinct from hurricanes, but some of the projected changes are similar - both atmospheric rivers and hurricanes should produce more rainfall in the future. Atmospheric rivers are projected to become more frequent, including over Florida, although this result may have some sensitivity to the method of defining atmospheric rivers. The changes in hurricane frequency are uncertain, but the most intense hurricanes are projected to become even more intense. So, at least by some measures, both atmospheric rivers and hurricanes affecting Florida are projected to become more intense in the future.
Add new comment