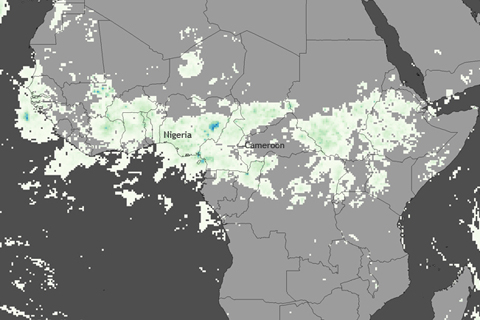
In August 2011, over seven inches of rain fell in a six-hour downpour in southwestern Nigeria. The torrential rains caused flooding and damage to infrastructure, buildings, and homes.
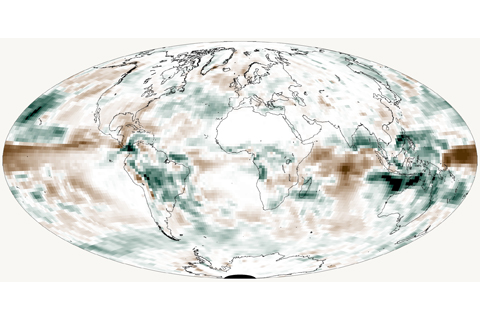
Seasonal precipitation patterns across the globe showed large differences from average in 2011, with several areas receiving heavy rains during more than one season of the La Niña-influenced year.
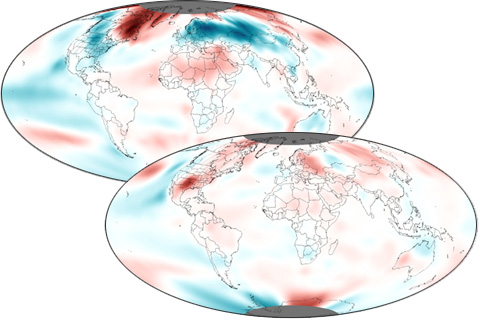
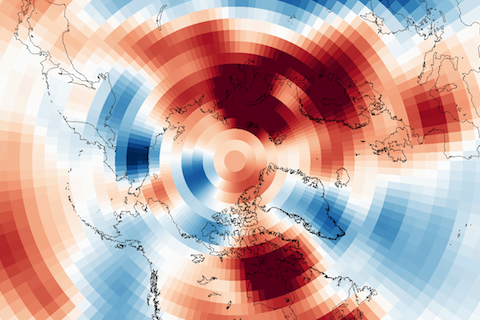
A year-long La Niña contributed to dramatic variability in seasonal temperature patterns in 2011.
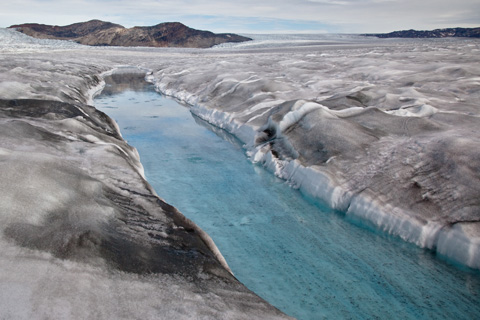
In the 2011 Arctic Report Card, scientists report that the bright white surface of the Greenland Ice Sheet has grown less reflective. The darker surface absorbs more sunlight, accelerating melting.
Climate forecasters often describe the Arctic Oscillation as the “wild card” of the winter forecast. So far in 2011, the Arctic Oscillation has been in its positive phase, playing the card that favors a milder winter in the eastern United States.

Molly Heller is part of a team of scientists who processes flasks of air samples in NOAA’s Earth System Research Laboratory in Boulder, CO. Week in and week out, Heller and her colleagues unpack sealed glass flasks shipped back to Boulder from dozens of remote sites around the world. What’s inside is priceless: air captured from a site near Tasmania’s Cape Grim; from Summit, Greenland; the Canary Islands; the South Pole.
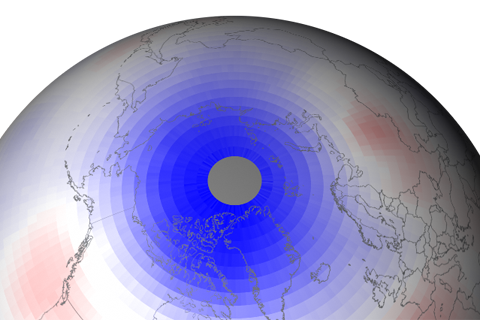
Compared to the large ozone hole that forms over Antarctica each year, Arctic ozone loss has generally been much more limited. But in 2011, Arctic ozone declined to surprisingly low levels. What did climate have to do with it?
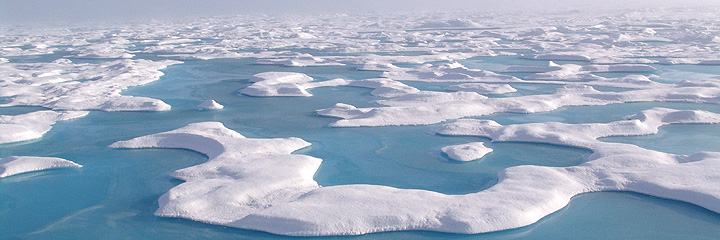
The low ice extent recorded this September continued the downward trend seen over the last 30 years. Meanwhile, scientists are finding that the ice cover has grown thinner, making it more vulnerable to melting during the summer.
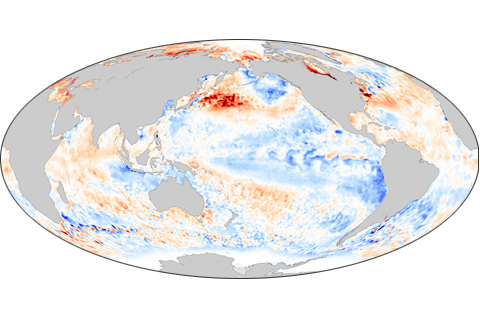
Following a brief interlude of “neutral” sea surface temperature conditions this summer, La Niña has returned to the tropical Pacific Ocean. The cool phase of the El Niño-Southern Oscillation climate pattern is expected to persist through winter.
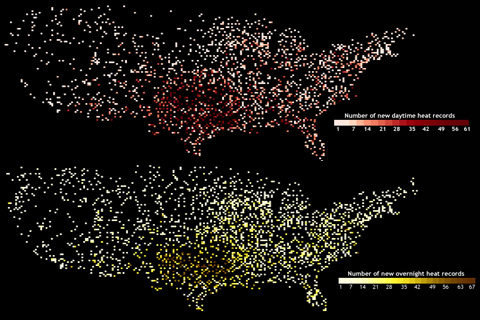
Maps of locations where heat records were broken in summer 2011 make a nearly complete picture of the United States.