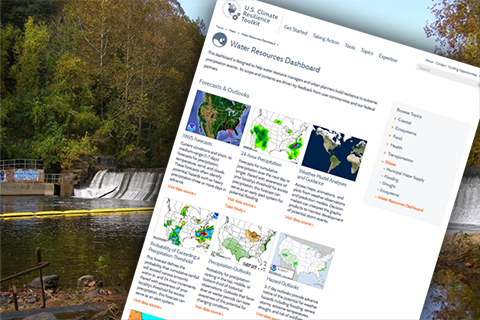
The Climate Resilience Toolkit's Water Resources Dashboard is a one-stop website for data and information on drought, flooding, precipitation, climate, and other water-related risks and opportunities.
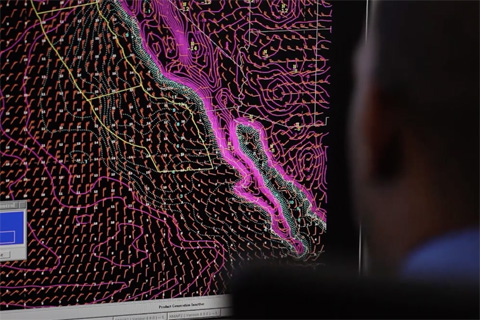
From changes in cooling degree days to the local effects of El Niño, the Local Climate Analysis Tool helps meteorologists and others understand the connection between global climate and local impacts.
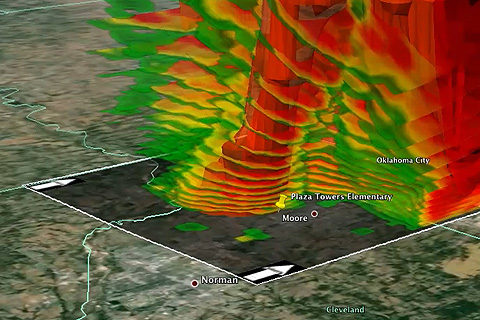
(VIDEO) Visualizing data makes it easier to understand exactly how an extreme weather event affected people’s lives, livelihoods, and property and how those things could be affected in the future. Knowing how to access and analyze the wide variety of datasets needed to study those events can be a challenge, however. NOAA's Weather and Climate Toolkit makes the job easier.