Summer 2012 Recap
Adapted from the August 2012 National Climate Analysis.
Summer 2012 was the third hottest summer on record for the contiguous United States since recordkeeping began in 1895. According to the latest national statistics from NOAA’s National Climatic Data Center, the average temperature for the contiguous United States between June and August was over 74° Fahrenheit, which is more than 2° F above the twentieth-century average. Only the summers of 2011 and 1936 have had higher summer temperatures for the Lower 48.
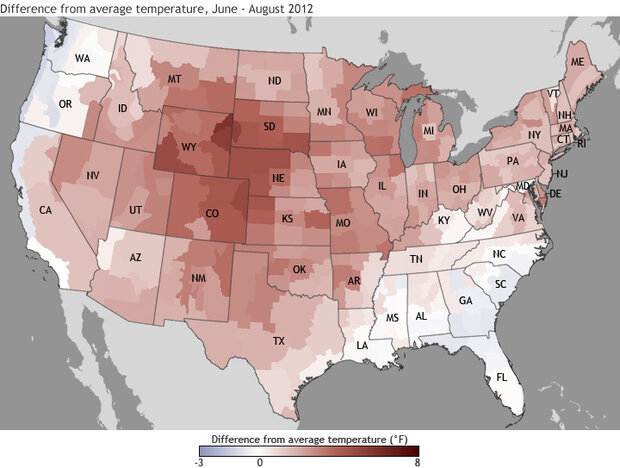
Reds show June-August temperatures up to 8° F warmer than average. Blues show temperatures up to 2° F cooler than average—the darker the color, the larger the difference. Map by NOAA climate.gov team, based on U.S. Climate Division Data from the National Climatic Data Center.
These maps show patterns of temperature (above) and precipitation (below) across the United States from June through August 2012 compared to the recent long-term average (1981-2010). The summer season was warmer than average for a large portion of contiguous United States, with the Southeast and parts of the Northwest being exceptions. Sixteen states across the West, Plains, and Upper Midwest had summer temperatures among their ten warmest. Colorado and Wyoming each had their record-hottest summer, and much of the Northeast was warmer than average, with seven states from New Hampshire to Maryland having a top-ten-warmest summer.
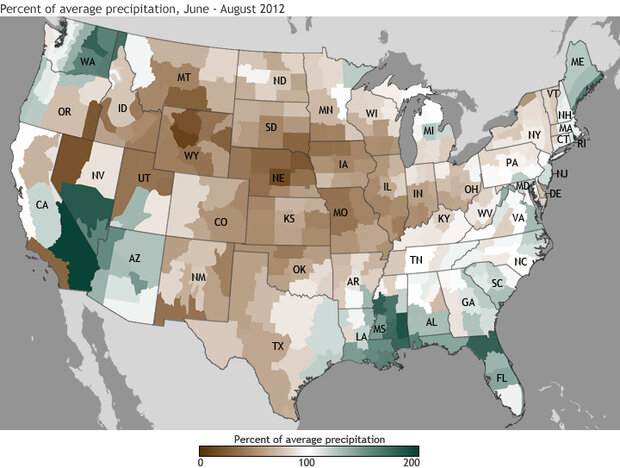
Browns indicate areas that received less than 100 percent of average June-August precipitation, while greens indicate up to 200 percent of average. Map by NOAA climate.gov team, based on U.S. Climate Division Data from the National Climatic Data Center.
Drier-than-average conditions prevailed across much of the central United States, from the Rocky Mountains to the Ohio Valley. Nebraska’s summer precipitation was almost 6 inches below average, and Wyoming’s precipitation was more than 2 inches below average, marking the driest summer on record for both states. Missouri, Illinois, Iowa, South Dakota, Nebraska, and New Mexico had summer precipitation totals among their ten driest.
However, the summer was wetter than average across the West Coast, the Gulf Coast, and New England. Florida had its wettest summer on record, partially driven by Tropical Storm Debby in June and Hurricane Isaac in August. The total statewide summer precipitation was almost 9 inches above the long-term average. In addition, Louisiana and Mississippi each had one of their ten-wettest summer seasons.
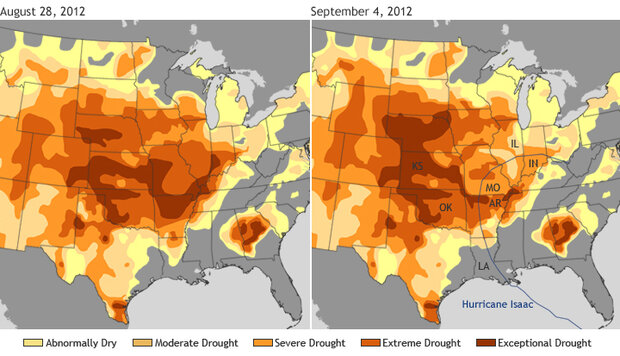
A comparison of drought maps* from August 28 (left) and September 4 (right) show how little relief Hurricane Isaac (estimated track shown by blue line) brought to parched states in the central U.S. A handful of states in the Lower Mississippi and Lower Ohio Valleys saw modest improvements. Maps by NOAA Climate.gov team, based on U.S. Drought Monitor Data. (*Update: This is an updated version of the image, with a more accurate estimate of the track of Isaac through the Lower Mississippi Valley.) Large maps: August 28 | September 4
The U.S. Climate Extremes Index (USCEI), an index that tracks the highest and lowest 10 percent of extremes in temperature, precipitation, drought, and tropical cyclones across the contiguous U.S. was more than one and a half times the average value during summer 2012, and marked the eighth largest USCEI value for the season. Extremes in warm daytime temperatures, warm nighttime temperatures, and extremely dry conditions covered large areas of the Nation, contributing to the above-average USCEI value.
These climate statistics and many others are part of NOAA’s National Climate Summary. The National Climatic Data Center produces these monthly climate reports as part of the suite of climate services that NOAA provides government, business, and community leaders so they can make informed decisions.
Reviewed by Jake Crouch, National Climatic Data Center.
![]()