September 2022 La Niña update: it’s Q & A time
Ocean and atmospheric conditions tell us that La Niña—the cool phase of the El Niño-Southern Oscillation (ENSO) climate pattern—currently reigns in the tropical Pacific. It’s looking very likely that the long-predicted third consecutive La Niña winter will happen, with a 91% chance of La Niña through September–November and an 80% chance through the early winter (November–January).
91%! That’s very high. Why so confident?
The first reason is that La Niña is already clearly in force in the tropical Pacific. The August sea surface temperature in the Niño-3.4 region, our primary location for ENSO monitoring, was about 1.0 °C (1.8 °F) cooler than the long-term average, according to ERSSTv5, our favorite dataset for sea surface temperature. (“Long-term” is currently 1991–2020.) This is substantially cooler than the La Niña threshold of 0.5 °C (0.9 °F) below average.
Sea surface temperatures in the tropical Pacific Ocean from mid-June through early September 2022 compared to the long-term average. East of the International Dateline (180˚), waters remained cooler than average, a sign of La Niña. Graphic by Climate.gov, based on data from NOAA’s Environmental Visualization Lab. Description of historical baseline period here.
La Niña’s characteristic tropical atmospheric response—more rain and clouds over Indonesia, less over the central Pacific, and stronger-than-average winds both aloft and near the surface—was also clearly active in August. Taken together, the oceanic and atmospheric conditions tell us that La Niña is solidly in place. Once active, La Niña conditions are reinforced by feedback processes between the ocean and atmosphere. Read more about those feedbacks here.
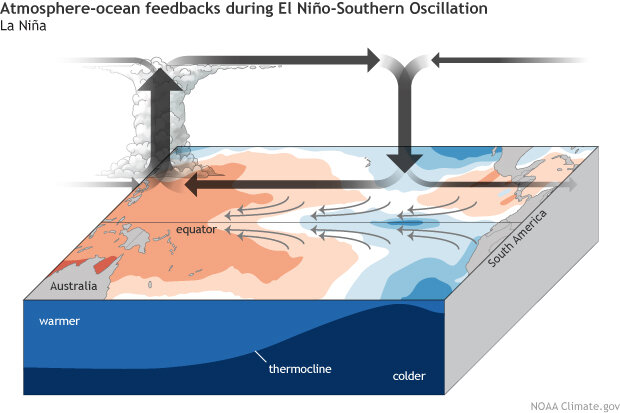
During La Niña, the surface trade winds (small gray arrows) blow more strongly than normal, piling up warm surface water in the western Pacific and drawing up deep, cool water in the eastern Pacific. Over the warm waters, the air becomes more buoyant (upward thick arrow), and rainfall increases. Over the cool waters, it is less buoyant, favoring subsidence (downward gray arrow) and less rainfall. These feedbacks between ocean and atmosphere strengthen the La Niña event. Climate.gov schematic by Emily Eng and inspired by NOAA PMEL.
What else is providing confidence in the forecast?
There is a substantial amount of cooler-than-average water under the surface of the eastern-central tropical Pacific. This subsurface water will provide a source of cooler water to the surface over the next couple of months. Also, the computer climate model consensus predicts that La Niña will continue into the winter.
How long will La Niña last?
While there’s high agreement through the winter, there is a lot of uncertainty about how long this La Niña will last and when we will see a transition to neutral conditions. Current forecaster consensus gives La Niña the edge through January–March (54%), with a 56% chance of neutral for the February–April period.
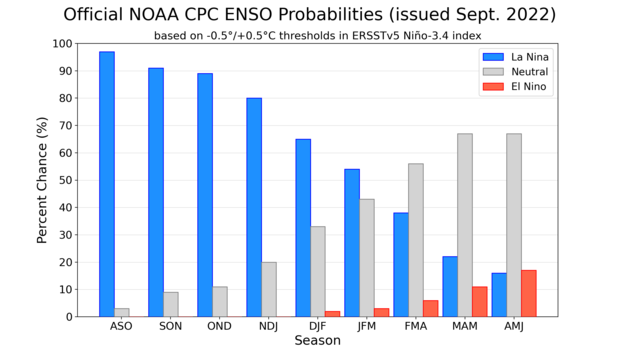
NOAA Climate Prediction Center forecast for each of the three possible ENSO categories for the next 8 overlapping 3-month seasons. Blue bars show the chances of La Niña, gray bars the chances for neutral, and red bars the chances for El Niño. Graph by Michelle L'Heureux.
When have previous La Niñas transitioned to neutral?
There are 24 La Niña winters in our historical record, which dates back to 1950. Of those, only one (2016–17) changed to neutral in December–February. Four transitioned to neutral in January–March, one (2000–01) by February–April, two by March–May, and 16 in April–June or later. Especially when you’re slicing and dicing a relatively short record, it’s tough to find truly analogous events. For example, this will be only the third La Niña three-peat on record, and the first not to follow a strong El Niño event.
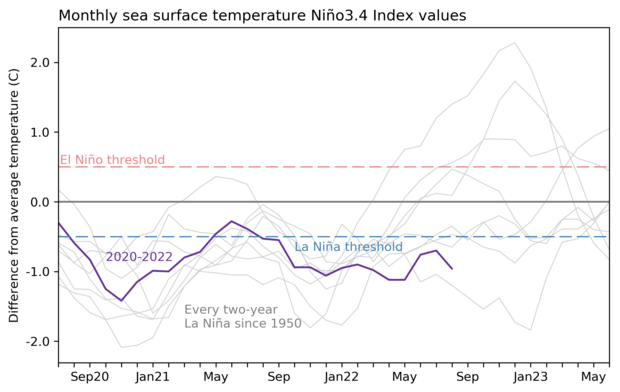
Three-year history of sea surface temperatures in the Niño-3.4 region of the tropical Pacific for the 8 existing double-dip La Niña events (gray lines) and the current event (purple line). Of all the previous 7 events, 2 went on to La Niña in their third year (below the blue dashed line), 2 went on to be at or near El Niño levels (above the red dashed line) and three were neutral. Graph is based on monthly Niño-3.4 index data from CPC using ERSSTv5. Created by Michelle L’Heureux.
All this is to say that past La Niñas aren’t providing much guidance on how long we can expect this event to last. The current forecaster estimate, which favors an earlier than typical transition to neutral, is based on computer model guidance.
Remind me why I should care about La Niña…?
I admit, as scientists, we sometimes get wrapped up in how interesting the inner workings of El Niño and La Niña are! But ENSO has some serious practical applications. In a nutshell, La Niña and El Niño affect global atmospheric circulation patterns in (somewhat) predictable patterns, altering jet streams and storm tracks around the world and influencing temperature, rain/snow, and tropical cyclone seasons. Since we can predict ENSO months in advance, we can get an early picture of potential upcoming climate patterns. Of course, nothing is guaranteed with weather and climate—ENSO merely “tilts the odds” toward certain patterns. For more on how ENSO affects climate patterns, as well as why it's so difficult to make specific predictions, check out Michelle’s post here.
Can I have some examples of how La Niña can affect North American weather?
Yes! Here’s a map, followed by a list of some specifics.
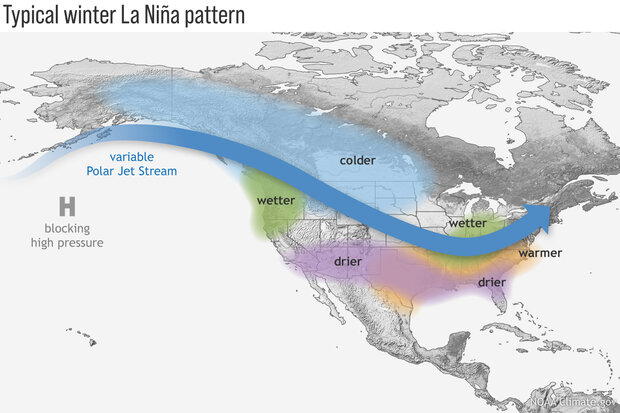
During La Niña, the Pacific jet stream often meanders high into the North Pacific. Southern and interior Alaska and the Pacific Northwest tend to be cooler and wetter than average, and the southern tier of U.S. states—from California to the Carolinas—tends to be warmer and drier than average. Farther north, the Ohio and Upper Mississippi River Valleys may be wetter than usual. Climate.gov image.
- La Niña tends to increase Atlantic hurricane season activity.
- La Niña winters tend to be drier through the southern tier of the US. This can lead to or exacerbate drought.
- La Niña can also result in wetter (and snowier) conditions for parts of the northern tier of the US.
- Nat recently looked into the potential for hotter, drier summers in Texas following La Niña winters.
- La Niña is linked to more frequent spring hailstorms and tornadoes in the south-central US.
- La Niña winters in Alaska tend to be cooler and wetter, and La Niña winters in Hawaii tend to be rainier.
- La Niña can reduce the number of atmospheric rivers impacting the West Coast.
What about global impacts?
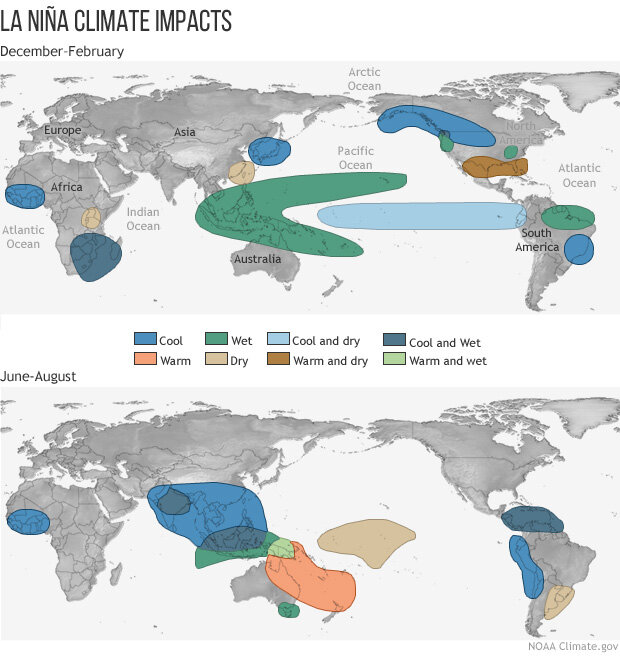
Temperature and precipitation patterns that are typical of La Niña during (top) Northern Hemisphere winters and (bottom) summers. Map by NOAA Climate.gov, based on originals from the Climate Prediction Center. Larger images and maps for El Niño are available in this post.
- La Niña can reduce crop yields in several regions around the world.
- La Niña tends to produce colder, drier conditions in west Antarctica.
- La Niña’s effect on South American climate is complex!
That’s enough for now! Thanks!
Anytime! See you next month.
Comments
La Nina
We are really concerned in California with the potential for another year of drought. The only real difference from last month is with the latest NMME 3.4 plot that came out early this week. NMME has scaled back 3.4 temps back to -1 from earlier runs whish showed a bit stronger La Nina temps around -1.3. This falls in line with the CFSv2 PDF corrected numbers. The ECMWF is forecasting a moderate El Nino next summer/fall although that is in the way too far to believe category although I would bet my money on that over a La Nina finally looks dead after this winter. Looks like the cold pool below the equator is continuing to dissipate over the coming months despite La Nina.
El Niño is not good for Wisconsin winters
I don’t think El Niño is coming next year sorry I hope El Niño never comes back
El Nino
Too early to say what will happen next winter. One model is already forecasting a moderate El Nino next year. No confidence in that yet prior to the Spring Predictibility Barrier yet but prepare yourself for an El Nino soon. It is most likely coming in the next couple of years.
May I have an El Niño please?
Down south we’d be happy to not see another La Niña.
Re: May I have an El Niño please?
I do not see any benefit to South Texas from a La Niña. The humidity is vastly higher, and the heat index rises about 10 degrees. So, an example, if it is 90 in Texas, it is actually 100 degrees. In addition, we have had quite a few high pressure systems. More heat. Not happy about that at all. La Niña can get to packing.
Hoping for El Niño
While some are saying "I hope El Niño never comes back" please have some consideration for other parts of the country.
We live in a very very dry forest in California. An El Niño winter would help a lot with the wildfire risks.
Sometimes El Nino and La…
Sometimes El Nino and La Nina impacts can lead to benefits in parts of the US. A common example is that heating bills tend to be lower with El Nino in the northern contiguous U.S. b/c El Ninos are often associated with above-average winter temperatures. This is why we we convey El Nino and La Nina "Advisories." If it meant bad impacts for everyone then we would probably use another word like "La Nina Warning."
El Nino
Seems there is something brewing in the Pacific and changes are coming. There sure is alot of warm water built up in the western Tropical Pacific. Would not be surprised to see an El Nino over the next winter or the one following.
Triple Laninas
I come from Jordan and we share one thing in common , that is forecast drought . All mediterranean-like climate regions ( Chile, Southwest Australia, Cape Town and Cape Canaveral, and California ) had been forecast to worsened drought this winter , but you may will find that Australian western provinces had hit above median precipitation thus by far, with few dry spots here and there . Likewise for Chile and other south hemisphere mediterranean climate spots . This is an intuition from me and do not take it as infallible : probably because the computers used for forecasting do Not have sufficient historical data with similar analogous years they err with greater margin for now, especially we're transitioning through autumn with much weather variability .
La Nina
Every article I’ve read says there have been three three-peats in the last 70 years but none state which years. It’d be interesting to know how the third year of La Niña shook out in the past.
There have been two prior…
There have been two prior three peats. The third winter of this past two events was 1975-76 and 2000-2001. If you're curious what happened over the US for those events this blog post from last year has historical maps from past La Ninas. As you can see, the impacts can be very different, so there really isn't evidence that we should expect anything different from a La Nina winter.
2021/2022 Tornado/Hail far below average
What is a possible explanation for why, given the correlation between La Niña and tornado hail frequency in the South Central U.S. stated above, 2021 and 2022 have been so significantly BELOW average following successive La Nina winters?
https://www.spc.noaa.gov/wcm/2021/ptorngraph-big.png
https://www.spc.noaa.gov/wcm/2021/phailgraph-big.png
Thank you!
Good question. And a…
Good question. And a question I'm not sure has a great answer yet. This goes along with questions regarding why this hurricane season in the Atlantic has not been that active even with a La Nina.
The simplest answer is that a correlation does not mean that during every single La Nina will we observe an increase in activity. There is a lot of variability.
Analog Years
Thanks for the updates .
Regarding the analogy years analysis, the years 1975, 2011, 2008, 1956 and winter 1976 appear to have similar patterns of ENSO and the combination of other climatic combinations . Trying to do an snalog forecast yesterday I found it was helpful to dismiss the idea that we're through ab three consecutive LaNina because there are few triplet consecutive LaNinas, the autumn 1975 and it's ENSO transition into winter 1975 was coming to the surface with each analog models I proposed. So why don't we just dismiss the idea of three run LaNinas and focus on the transition by its natural course especially neutral and Nino conditions appear to be imminent . Heat waves in the northern Hemisphere this year may have latent effect to unleash in the coming two months .
Thank you again for your great efforts.
Warmest Jordanian Regards
Mohammad
Forecasters aren't just…
Forecasters aren't just using analogs to forecast so just because it is a triple La Nina does not mean that forecasters are using a sample size of 2 to guide the forecast. Models are used considerably.
sample size
Hi Tom . It is one single season, many . so the sample size is adequate . Talking about a season the data matrix becomes bigger because the outlook is longuitidinal and equals the number of seasons multiplied by the months or weeks . Three years denote 18 monthly data points , four years denote 24 monthly data points . I agree however a single season isn't enough to extrapolate /make surmising .
Best Regards
Mohamed
Current Water Temp in Southern California and Hurricane Kay
Can you explain why the current conditions in Southern California do not mimic past La Niña events? Usually the hurricane season is decreased or nonexistent in La Niña events. Also, the last time one traveled this far north was the El Niño of 97/98. What does this warming tell us?
No two La Ninas are the same…
No two La Ninas are the same, and they certainly also aren't the only climate game in town. Sometimes the randomness of our weather can lead to impacts that don't seem consistent with La Nina.
The truth is sometimes these things happen. There is a lot of variability still.
La Nina, North Atlantic High and the gulfstream
I am curious to understand if the Gulf Stream is slowing (or has been slowed down) because of the very persistent and stable North Atlantic Ridge of High Pressure reaching from roughly Iceland, UK to Norway, generating an Easterly wind across the Atlantic for months on end!
regards
The Atlantic Meridional…
The Atlantic Meridional Overturning Circulation where the Gulf Stream is a surface branch is slowing. One reason I've seen posited is that this is due to the freshening of the North Atlantic due to ice melt.
Funny this time last year…
Funny this time last year you predicted La Niña would be gone by spring then gone by summer. Yet here we are. First august to not have US land falling TS or hurricane since 1997. All the while predicting above average land falling systems. 2020 for instance in the SE US had a terribly stormy tornadic spring followed by so many TS’s we had to use the Greek alphabet. Not until La Niña kicked in (from a enso neutral pattern) strong, did they stop at the end of October.
Can’t predict Mother Nature. You can only guess. The only thing scary about a La Niña winter is a tornado event like December 2021 that ravaged mayfield Ky and many other states. I’m ready for a real winter for the United States SE as it’s been years since we’ve had any significant cold.
La Nina
La Nina's typically wane in the spring and summer months and then can return in the fall and winter months.
Will the coming winter colder?
I live in California, will the coming winter be colder than last year?
The Climate Prediction…
The Climate Prediction Center has seasonal outlooks here. The current outlook for winter shows a 33-50% chance of above-average temperature for most of CA. This outlook will be updated on Friday, Sept. 16. These outlooks take a number of factors into consideration, including ENSO, trends, other climate patterns, and model predictions.
Looking at tornado activity during La Nina, Neutral and El Nino
I harvested this data from here: https://origin.cpc.ncep.noaa.gov/products/analysis_monitoring/ensostuff… and here: https://www.spc.noaa.gov/climo/online/monthly/newm.html The data is grouped by three month periods (JFM is Jan, Feb< March as an example) as that is how the La Nina / El Nino data is reported.
La Nina + MOJ
Hi guys, fantastic work as always, thank you!
I was wondering if there are any forecasts/signs that the MOJ might, at any point in the coming months, enhance rainfall in Colombia due to “constructive interference”. Is there any way one would be able to track/monitor that?
Thanks!
Thanks! MJO forecasts extend…
Thanks! MJO forecasts extend out a couple of weeks into the future. Maybe, with a lot more research, we'll get to monthly or seasonal MJO forecasts, but not yet! The current forecast is not very clear at all, either. You can read more and see the current forecasts here.
Nino3.4 Temps
Have the Nino3.4 temps bottomed out? Looking at the CDAS Nino 3.4 Index line since late August the timeline looks flat.
bottoming out
This prolonged La Nina has fooled me enough with short-term sea surface temperature variations, so I am not prepared to conclude that it has bottomed out. It seemed to have bottomed out several times before coming back down to levels near what we saw at the peak last fall. Some forecast models suggest that we should be near the lowest point, and some suggest we will get a little cooler by late fall. So, I don't expect Nino 3.4 sea surface temperatures to get much cooler than what they are now, but I cannot say that we have bottomed out yet.
Thanks Nathaniel!
Thanks Nathaniel!
el nina forecast
Thank you Very much for this primer about el nina and current situation. I learned a lot and helps me to understand hurricane influence.
Prediction
Going to be a very nice mild winter perfect for us trekkers , but bad for the ski resorts who will be panicking because there will be no snow for skiing.....ha ha ..... that's how it's going to be.
Triple Dip La Nina
Could the Author of this great writeup or any expert define what is a Triple Dip La Nina ?
Is Triple Dip La Nina a three continuous years La Nina condition or is it three consecutive La Nina with transition to Enso neutral conditions in between these consecutive La Nina ?
In this case, we are…
In this case, we are defining triple dip La Nina as three consecutive northern hemisphere winters with La Nina conditions present.
Floods in Pakistan, N. India: what meteorological reason?
Very heavy rains in the Karakoram Range has flooded 1/3 of Pakistan downriver. Very heavy rains in the central Himalayas so late in September also has caused floods, after a summer sowing season marked by intense drought.
What global meteorological conditions might have influenced these events?
Do you also study the Monsoon Trough that build up over the Ganga plains and causes lower than normal rainfall underneath it? 2 streams of descending air, one from the Himalayas, the other from central India? Thanks in advance
La Nina and Pakistan
La Nina tends to produce wetter-than-normal conditions in the Pakistan region, and many Pakistan floods have occurred during La Nina. So, this La Nina may have been a factor in the recent floods, but other factors likely were necessary for such extreme conditions. I don't have the answers about what those factors, but this external blog post by Moet Ashfaq speculates on some of these factors.
La Nina weather summary
Thank you for this friendly to read and easy to follow, informative article. You do great work... Thank you!
Temperature difference between ENSO s
Hello! Could I ask if there is a historical pattern of planetary temperature difference between the effects of La Niña, Neutral and El Niño ?
If La Niña cools down the planet, how much warmer can it get just by changing to a neutral pattern, and how much warmer yet by heading into an El Niño?
Thanks for your information and great blog!
ENSO and global temperature
Thanks for your question! Yes, ENSO does have a significant (though temporary) influence on globally averaged temperature. La Nina typically cools the globe by up to a few tenths of a degree Celsius, whereas El Nino typically warms it by a similar amount. Please feel free to check out these past blog posts (here and here) for more information.
Why is it raining in the…
Why is it raining in the mountains of Costa Rica now when it is always dry and windy? Does it have something to do with La Nina?
Add new comment