First dates: When does the climate record say you can expect the season's first snow?
Near the anniversary of Beyond the Data's most popular post, we've given the map an interactive upgrade. Click to zoom in on an area of interest and drill down to see the date by which the chances for the first snow of the season at your location rise to at least 50%. Will this year's first snow come earlier or later than the historic "first date" of snow? See what the climate record has to say and keep up with your local forecast.
This map shows the historic date by which there’s a 50% chance of at least 0.1” of snow on the ground, based on each location’s snowfall history from 1981-2010, based on the latest U.S. Climate Normals from NOAA's National Centers for Environmental Information. Double click on the map to zoom in, or use controls at upper left. Single click for specific location information. To improve map performance and loading times, station pop-ups appear at zoom levels of 2x or more.
Original post: October 25, 2015
So, the Climate.gov editors wanted me to write about first dates. Well, I spilled spaghetti sauce all over myself and got a speeding ticket. Then we saw The Princess Bride.
Oh wait, a clarification: the first date of snowfall. That was awkward.
So… it’s about that time of year, and for some of you, it’s already happened. Winter’s first snow. For those who are still waiting, here’s a handy historical map that ballparks the first day of snow for an average year. It’s based on the “normals” dataset constructed here at the National Centers for Environmental Information—the same dataset from which the familiar “Today’s normal high is ____” bit of your weathercast is drawn.
Before we dive into interpretation, a few caveats: this map isn’t the average date of the first observed snowfall. Technically, it’s the date by which there’s a 50% chance at least 0.1” of snow will have accumulated. It’s based on historical patterns from 1981-2010, with some “smoothing” to account for statistical noise in the data.
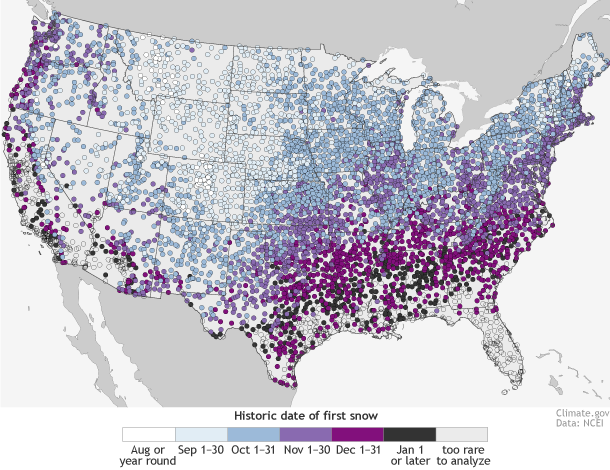
Colored dots indicate the date by which there’s a 50% chance at least 0.1” of snow will have accumulated, based on each location’s snowfall history from 1981-2010. Click the map for a larger version with more detailed categories. Map by NOAA Climate.gov, based on analysis of the US Climate Normals by Mike Squires, National Centers for Environmental Information. *Update: 10/27, 3:43 pm. We've released updated versions of these maps. The original versions were missing some locations in the "August or year-round risk" category. Also, Alaska has been added to the large version of the map.
A quick look at the map reveals the obvious: the main factors that govern the average day of your first snow are the same main factors that govern your other major climate characteristics: latitude and altitude. In general, the farther north you are, and the farther up you are, the earlier the threat of first snow. In fact, the highest elevation stations along the spines of the Rockies have a year-round threat of snow. On the other end of the spectrum, the Deep South, Gulf Coast, Desert Southwest and Hawaii have many stations that get snow so infrequently, there’s no date listed (empty circles). In these places, there just aren’t enough events to make robust statistics.
There are also a few interesting, but more subtle, regional features. Across the Plains and Midwest, instead of a straight-up east-west pattern, there’s a slight northeastward tilt, where earlier dates plunge farther southward in the plains, relative to the more Midwestern states. It’s especially noticeable along a line stretching roughly from the Texas panhandle to Chicago. This has a little bit to do with elevation, but more to do with the fact that the coldest air associated with many winter storms—including early winter storms—often barrel down the high plains, corralled by the Rockies to the west.
You may also notice subtle plumes of earlier dates peeking south from the Great Lakes. If you grew up near their southern shores, you know the drill: the first very cold, northerly winds of autumn can pick up a lot of moisture from the still-relatively-warm lakes. This often results in a rather rude, and rather early, annual introduction to winter precipitation. It’s already happened this year in parts of Michigan and upstate New York.
As you might expect, the first date of snowfall isn’t a constant thing. It varies naturally, like many other climate variables. That’s why we call them “variables,” right?
For example, take a look at Dodge City, Kansas. The dots on this graphic show the first date with one-tenth* of an inch or more snow for each cold season from 1950/51 (top) through 2014/15 (bottom).
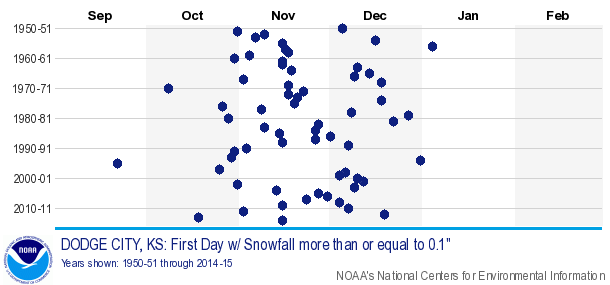
First measurable snowfall each year since 1950, based on daily Global Historical Climatology Network data.
The dots span from mid-September at the earliest to early January at the latest. That’s a three-and-a-half-month spread!
What about a changing climate?
For any given place, the date of the first snow of the season may be affected by our changing climate. But not necessarily in obvious ways. For starters, we know that in the long-term, Northern Hemisphere snow cover isn’t changing dramatically for most of the autumn months. (Spring is another story.) And even in a warming world, there is still plenty of sub-freezing air hanging around in October in parts of the Canada and the Arctic. Meteorological systems can still yank this cold air into place to support snowfall just like they did 50 years ago, and can still do it fairly early on the calendar.
And then there are some basic statistical factors that could make any trends less than obvious. Snow, relatively speaking, is a pretty rare thing for almost all of the contiguous United States, even during winter. We record temperature every day, and that sizable collection of data provides a robust statistical base for detecting trends over time. But snow, for most places, even during a snowy winter, only occurs on a limited number of days each year. The less data there are, the harder it is to detect a change over time.
Observed changes in first-snow date are much more locally specific - and much less consistent - than the much more obvious changes we see with precipitation extremes or intense heat. For example, while there appears to be a clear trend toward later first-snow dates in Yakima, Washington, evident in the down-and-to-the-right tilt of the dots on its graph, that apparent trend is not supported at nearby Pendleton, Oregon.
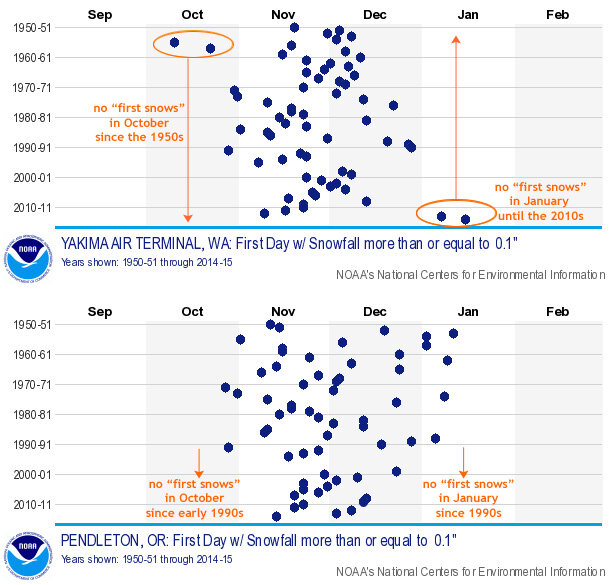
First measurable snowfall in Yakima, Washington (top), and Pendelton, Oregon (bottom) since 1950, based on daily Global Historical Climatology Network data.
Finally, no article about snow can ignore Boston, the epicenter of some pretty nasty snowstorms (and snow seasons) in recent years. If it seems to Bostonians that the last few years have seen some pretty early snows, that’s precisely the case.
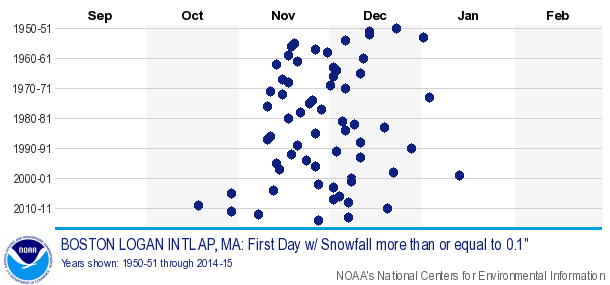
First measurable snowfall in Boston, Massachusetts, each year since 1950, based on daily Global Historical Climatology Network data.
So there you have it, a deeper look at our annual first date with snow. Much like a first date of the other variety, these first dates can be a little unpredictable, a little sensitive to where they occur, and a lot unaware of the big world going on around them. But one thing’s for sure: they won’t end up wearing spaghetti sauce.
Thanks for going Beyond the Data.
*Correction. The original text incorrectly stated one inch.