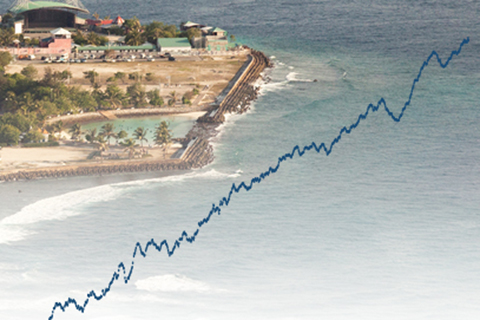
In 2014, global average sea level was 2.6 inches (67 mm) above the 1993 average, which is the highest yearly average in the satellite record.
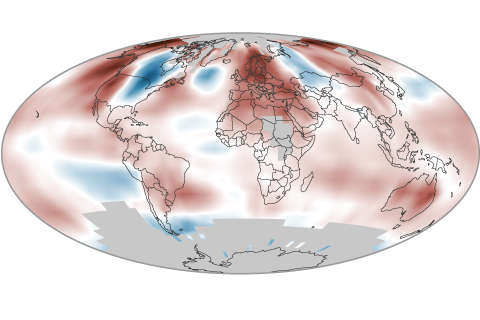
Depending on the data set, 2014 was either the warmest or tied-for-warmest year since records began in the mid-to-late 1800s.
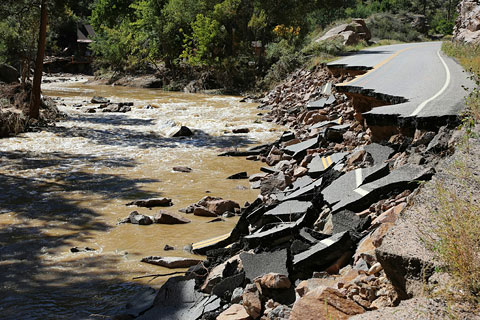
After an extremely heavy rain in September 2013 destroyed 500 miles of roads, Colorado is redesigning some riverside roadways to be more resilient to future floods.
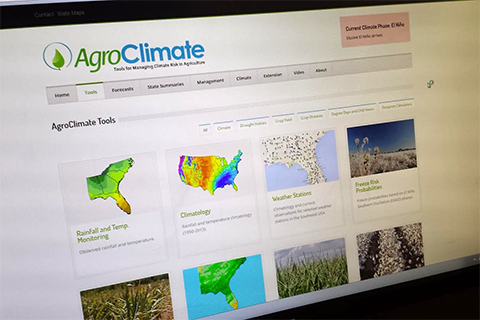
AgroClimate.org is an open-source suite of tools and resources tailored to farmers and ranchers in the southeastern United States.
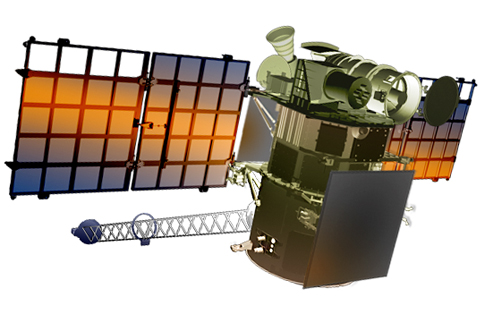
In addition to its primary mission of observing space weather, the Deep Space Climate Observatory (DSCOVR) satellite is carrying two instruments that are important to climate science: the NISTAR radiometer and the EPIC camera.
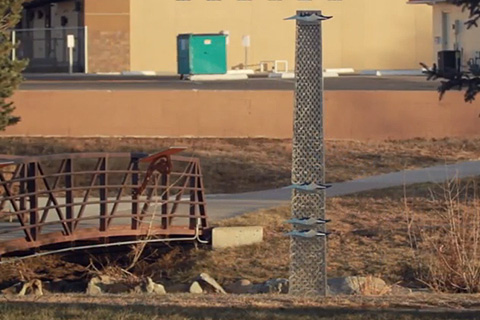
After a nightmare flood in 1997, Fort Collins, Colorado, stepped up efforts to improve resilience in the face of extreme events--efforts that will also serve the community well if climate change leads to heavier rainstorms.
Already a threat to fish, mussels, and other marine creatures, low-oxygen “dead zones” are expected to increase in both size and number as greenhouse gas concentrations and global temperatures continue to rise.
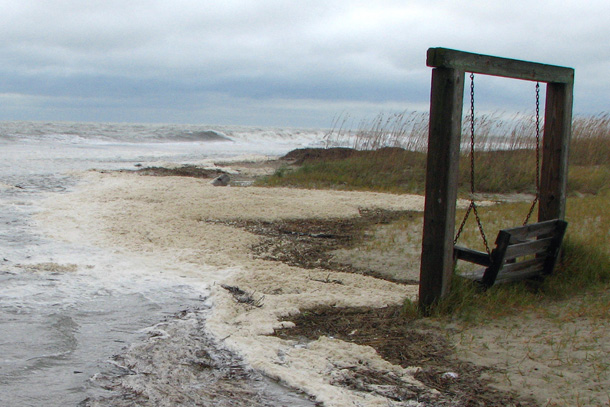
Maps and images from NOAA's online sea level rise viewer helped city officials in Tybee Island, Georgia, raise awareness of the city's vulnerabilities and set priorities for adaption efforts.
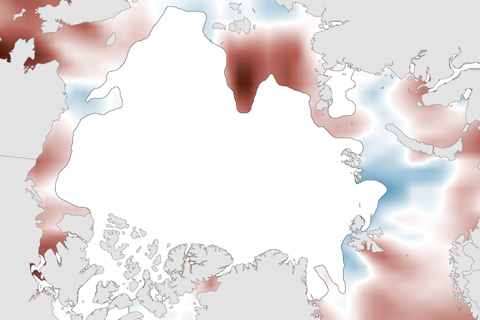
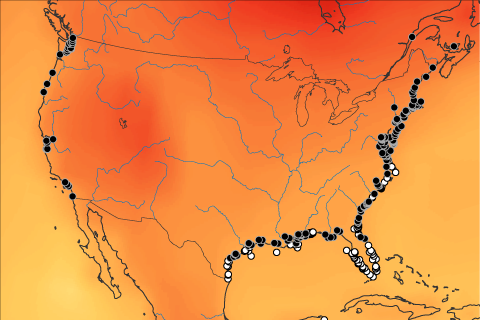
Compared to 2012’s extreme warmth, surface water temperatures were more moderate in summer 2014. Nevertheless, pockets of very warm temperatures existed.
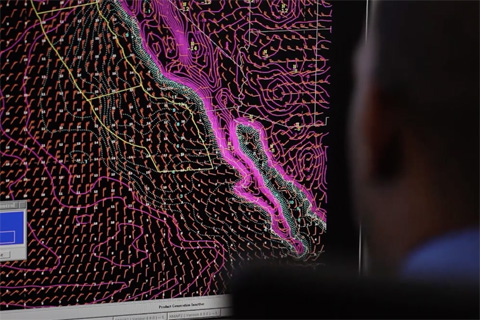
From changes in cooling degree days to the local effects of El Niño, the Local Climate Analysis Tool helps meteorologists and others understand the connection between global climate and local impacts.